Categories: Technical analysis

Natural Gas Wave Analysis – 19 July, 2019

  • Natural Gas falling inside impulse wave 3
  • Further losses are likely


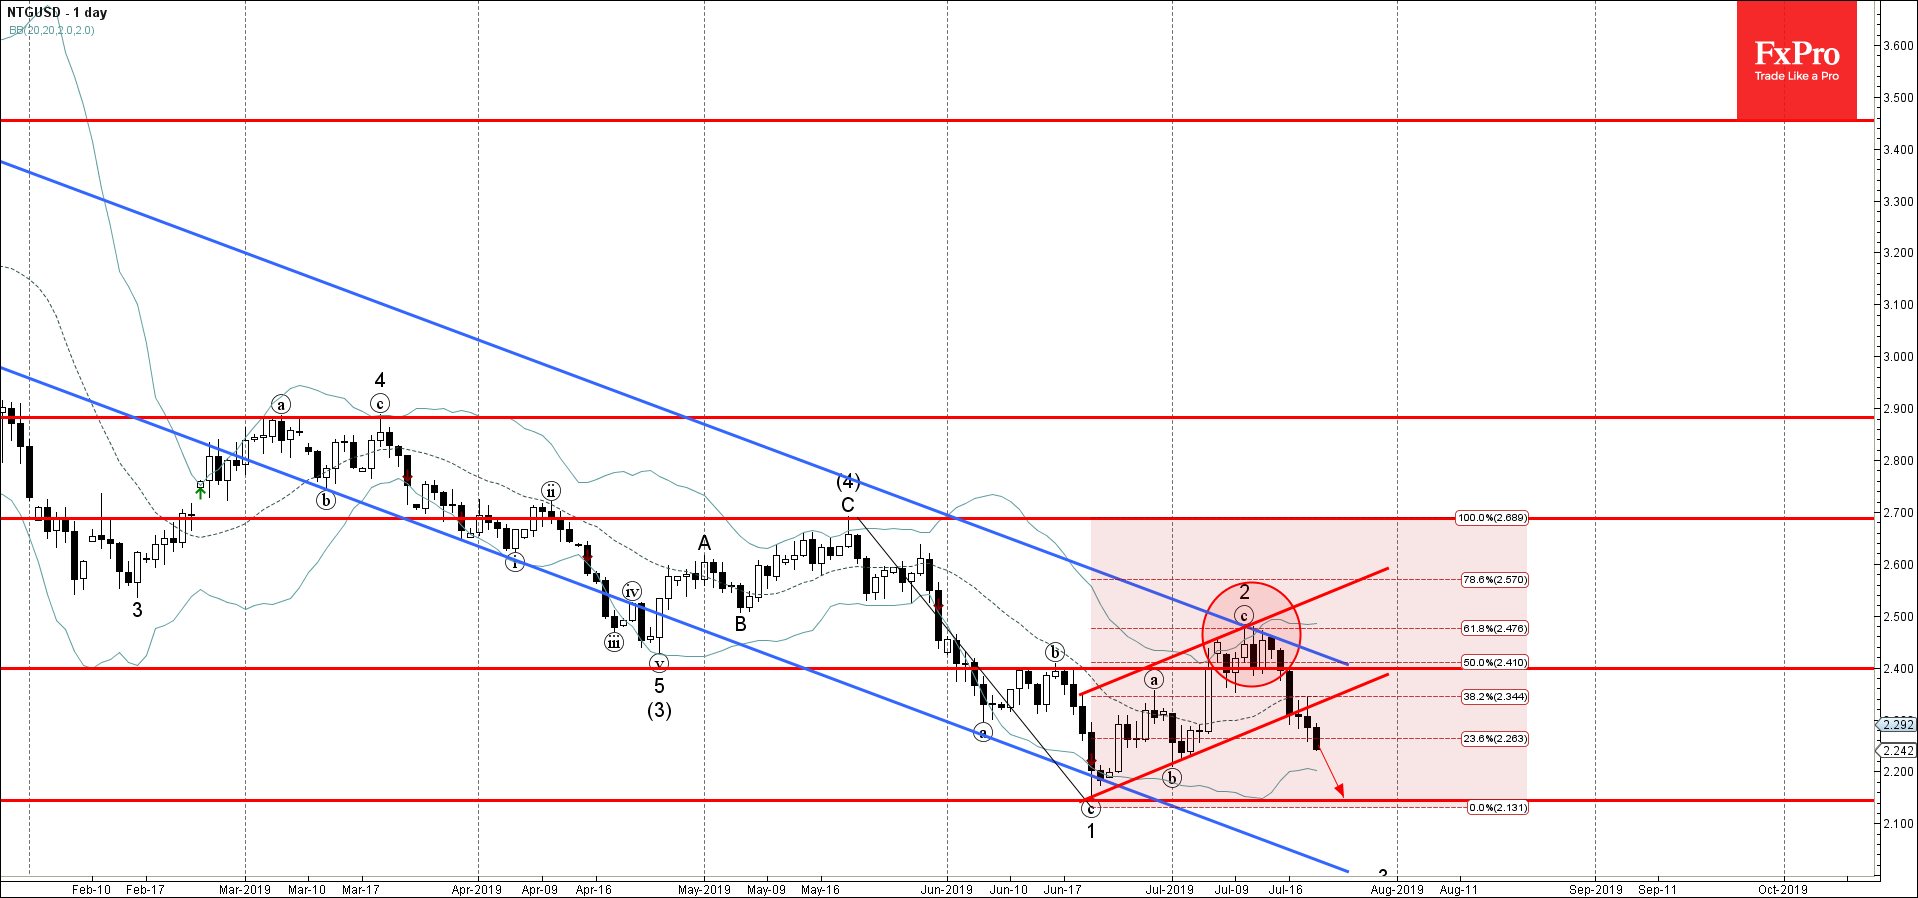
Natural Gas continues to fall sharply inside the short-term impulse wave 3, which previously recently broke the support trendline of the daily up channel from June (which enclosed the pervious ABC correction 2).

The breakout of this up channel accelerated the active impulse waves (5) and 3 – which belongs to the longer-term downward impulse sequence from last November.

Natural Gas is expected to fall further and retest the next support level 2.144 (low of the previous impulse wave 1).

The FxPro Tech Analysis Team

The FxPro technical experts prepare a daily analysis of the most active currency pairs (majors, crosses, exotics) and commodities. Selected instruments are reviewed on daily trends (D1, H4), using the active Elliott Wave setups, Japanese candlesticks, indicators, and support/resistance levels.

Share
Published by
The FxPro Tech Analysis Team
Tags: NTGUSD

Recent Posts

Video: Dollar and Indices are trying to find footing after the fall

The dollar experienced a sell-off but rallied back up by the end of the week.…

2 days ago

What is next: BoJ, Fed, SNB & BoE Rates

The new week will be packed with economic data and decisions from key central banks.…

2 days ago

Dollar attempts to rebound after oversold conditions

Despite economic factors working against the dollar, its oversold condition helped it this week or…

2 days ago

USDCAD Wave Analysis – 14 March 2025

USDCAD: ⬇️ Sell - USDCAD reversed from key resistance level 1.4500 - Likely to fall…

2 days ago

Solana Wave Analysis – 14 March 2025

Solana: ⬆️ Buy - Solana reversed from the long-term support level 113.75 - Likely to…

2 days ago

Adobe Wave Analysis – 13 March 2025

Adobe: ⬇️ Sell - Adobe broke round support level 400.00 - Likely to fall to…

3 days ago

This website uses cookies