Categories: Technical analysis

Natural gas Wave Analysis – 17 May, 2022

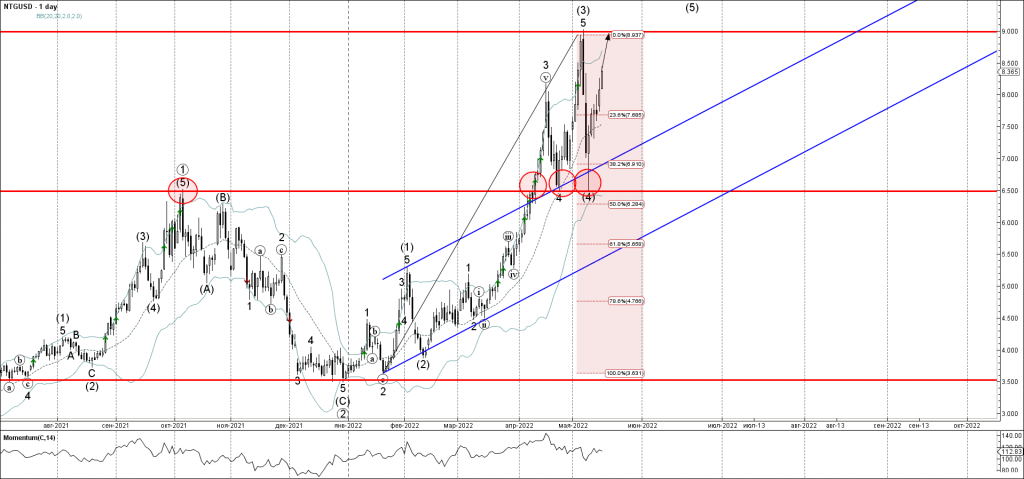
• Natural gas reversed from support level 6.500
• Likely to rise to 9.000

Natural gas recently reversed up from the strong support level 6.500, coinciding with the 20-day moving average and the 50% Fibonacci correction of the upward impulse wave (3) from February.

The support zone near the support level 6.500 was further strengthened by the upper trendline of the recently broken up channel from January.

Given the clear daily uptrend – Natural gas can be expected to rise in the active impulse wave (5) toward the next resistance level 9.000 (top of the previous wave (3)).

The FxPro Tech Analysis Team

The FxPro technical experts prepare a daily analysis of the most active currency pairs (majors, crosses, exotics) and commodities. Selected instruments are reviewed on daily trends (D1, H4), using the active Elliott Wave setups, Japanese candlesticks, indicators, and support/resistance levels.

Share
Published by
The FxPro Tech Analysis Team

Recent Posts

Crypto Market Retreats Due to Overhang of Sellers

Market picture The crypto market has lost 3.3% in the last 24 hours to $2.3…

9 hours ago

USDJPY Wave Analysis 26 April 2024

- USDJPY broke key resistance level 155.00 - Likely to rise to resistance level 160.00…

3 days ago

Ebay Wave Analysis 26 April 2024

- Ebay reversed from support level 49.35 - Likely to rise to resistance level 52.55…

3 days ago

False Alert with Yen Interventions?

Even though the Bank of Japan left the key rate and parameters of the QE…

3 days ago

Cooler Bitcoin

Market picture  Market Dynamics: The cryptocurrency market stabilised, losing just 0.1% of capitalisation and dropping to…

3 days ago

GBPCAD Wave Analysis 25 April 2024

- GBPCAD reversed from key support level 1.6910 - Likely to rise to resistance level…

4 days ago

This website uses cookies