Categories: Technical analysis

Natural gas Wave Analysis – 15 September, 2020

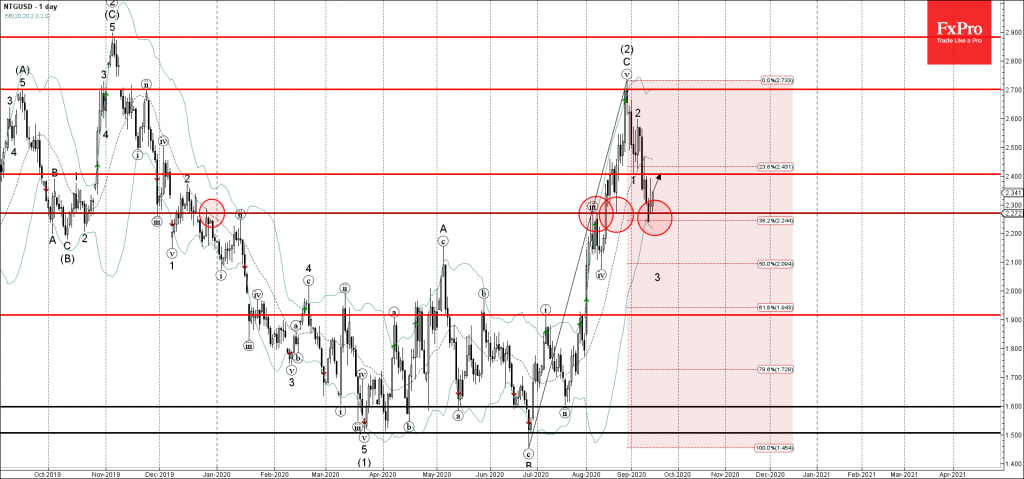
• Natural gas reversed from support level 2.270

• Likely to rise to 2.400

Natural gas recently reversed up from the support level 2.270 (former resistance from August) – standing near the lower daily Bollinger Band and the 38.2% Fibonacci correction of the upward wave C from June.

The price yesterday formed the daily Long Legged Doji near the support level 2.270 indicating its strength.

Natural gas is likely to rise further toward the next resistance level 2.400 (former strong support which ended the previous impulse wave 1 at the start of September).

AddThis Website Tools
The FxPro Tech Analysis Team

The FxPro technical experts prepare a daily analysis of the most active currency pairs (majors, crosses, exotics) and commodities. Selected instruments are reviewed on daily trends (D1, H4), using the active Elliott Wave setups, Japanese candlesticks, indicators, and support/resistance levels.

Share
Published by
The FxPro Tech Analysis Team
Tags: NTGUSD

Recent Posts

Adobe Wave Analysis – 13 March 2025

Adobe: ⬇️ Sell - Adobe broke round support level 400.00 - Likely to fall to…

3 hours ago

Apple Wave Analysis – 13 March 2025

Apple: ⬇️ Sell - Apple broke support area - Likely to fall to support level…

3 hours ago

Gold Wave Analysis – 13 March 2025

Gold: ⬆️ Buy - Gold broke resistance level 2962.00 - Likely to rise to resistance…

4 hours ago

EURGBP Wave Analysis – 13 March 2025

EURGBP: ⬇️ Sell - EURGBP reversed from key resistance level 0.8450 - Likely to fall…

4 hours ago

Gold climbs on lower rate speculations

The gold price has resumed updating its all-time highs on the back of speculations around…

10 hours ago

Crypto: just a bumpy downtrend

The crypto market experienced a drop, but towards the end of the week, there was…

11 hours ago