Categories: Technical analysis

Natural gas Wave Analysis – 15 November, 2019

  • Natural gas reversed from support area
  • Likely to rise to 2.700

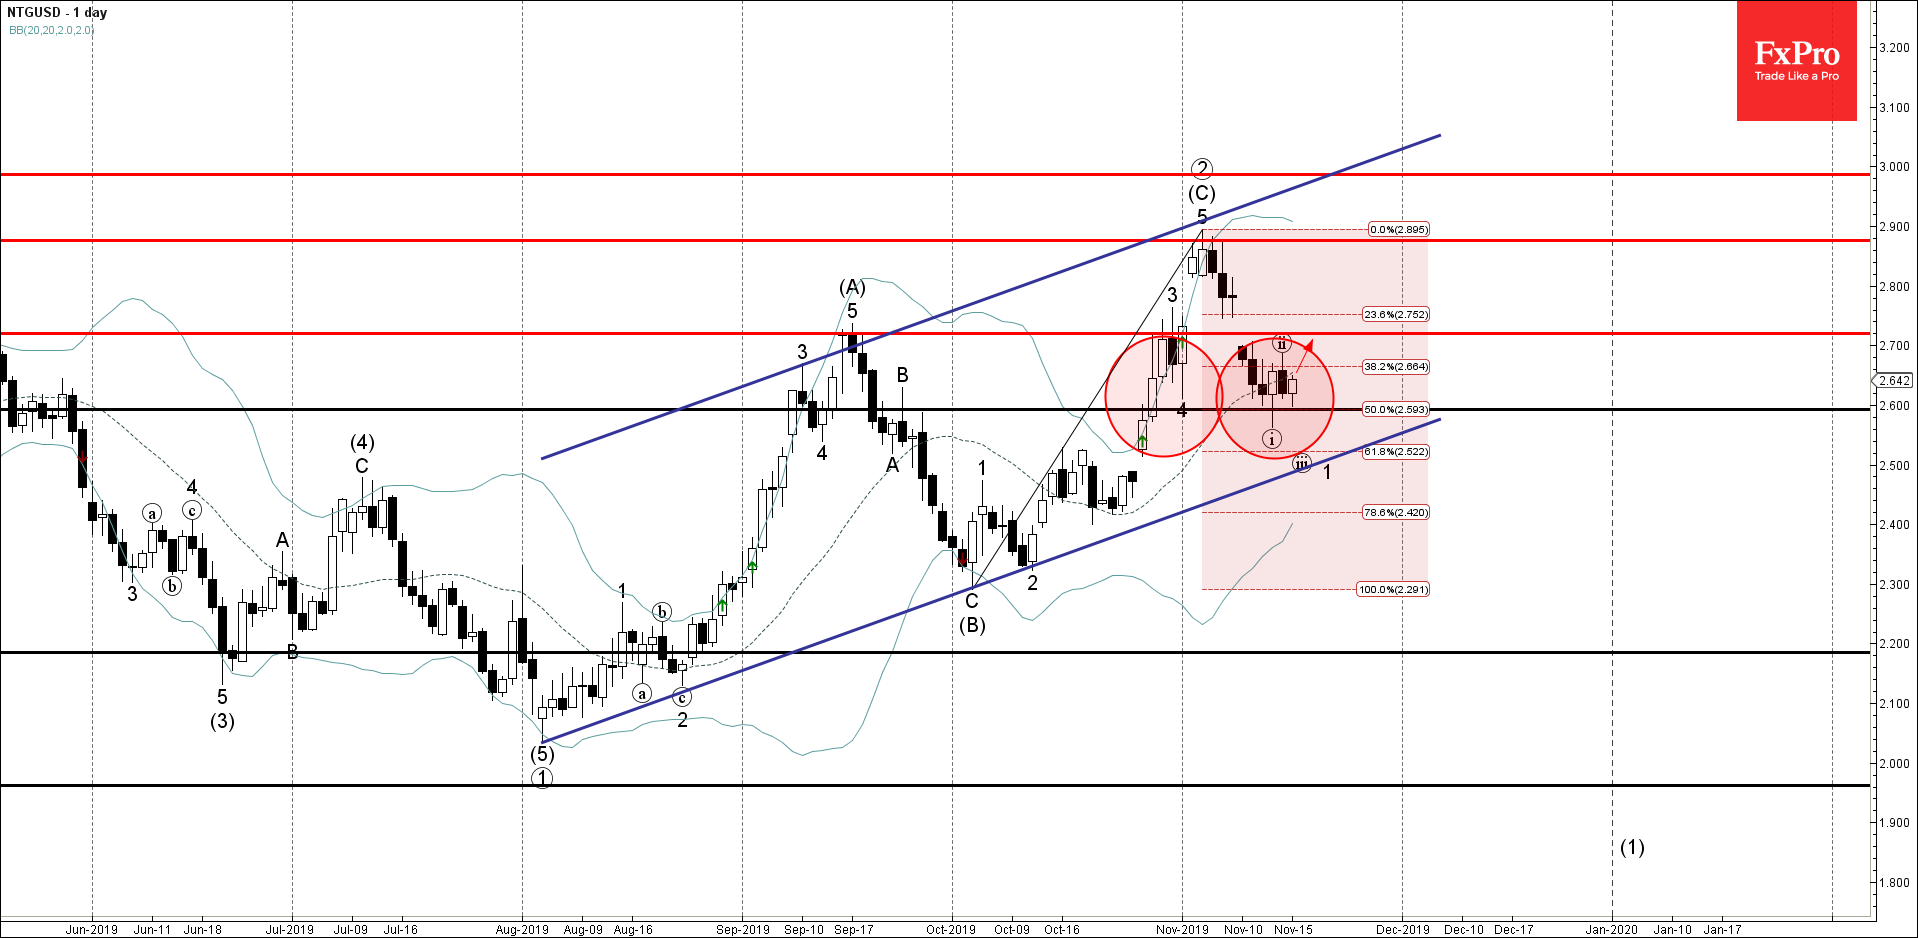
Natural gas recently reversed up from the support area lying between the support level 2.600, lower daily Bollinger Band and the 50% Fibonacci correction of the previous upward impulse (C) from the start of October.

The upward reversal from this support area stopped the earlier short-term impulse wave 1.

Natural gas is expected to rise further toward the next resistance level 2.700 (which reversed earlier wave (ii))

The FxPro Tech Analysis Team

The FxPro technical experts prepare a daily analysis of the most active currency pairs (majors, crosses, exotics) and commodities. Selected instruments are reviewed on daily trends (D1, H4), using the active Elliott Wave setups, Japanese candlesticks, indicators, and support/resistance levels.

Share
Published by
The FxPro Tech Analysis Team
Tags: NTGUSD

Recent Posts

ANF Wave Analysis 29 April 2024

ANF reversed from key support level 113.40 Likely to rise to resistance level 132.31 ANF…

15 hours ago

GBPUSD Wave Analysis 29 April 2024

- GBPUSD rising inside minor correction 2 - Likely to rise to resistance level 1.2700…

15 hours ago

Crypto Market Retreats Due to Overhang of Sellers

Market picture The crypto market has lost 3.3% in the last 24 hours to $2.3…

1 day ago

USDJPY Wave Analysis 26 April 2024

- USDJPY broke key resistance level 155.00 - Likely to rise to resistance level 160.00…

4 days ago

Ebay Wave Analysis 26 April 2024

- Ebay reversed from support level 49.35 - Likely to rise to resistance level 52.55…

4 days ago

False Alert with Yen Interventions?

Even though the Bank of Japan left the key rate and parameters of the QE…

4 days ago

This website uses cookies