Categories: Technical analysis

Natural gas Wave Analysis 15 March, 2021

• Natural gas broke key support level 2.570

• Likely to test support level 2.4300

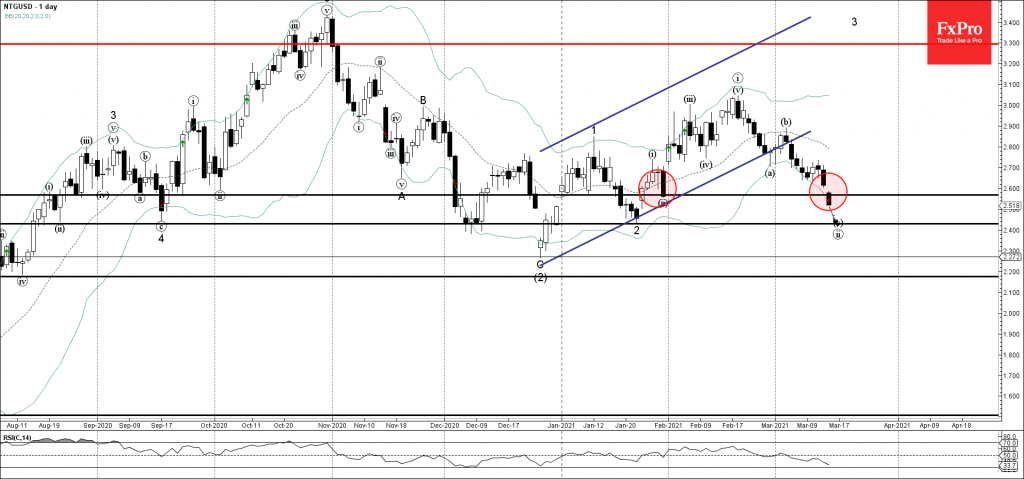
Natural gas opened today with the downward gap which broke the key support level 2.570 (low of the minor correction (ii) from the end of January).

The breakout of the support level 2.570 accelerated the active minor impulse wave (c) of the ABC correction (ii) from last month.

Natural gas can be expected to fall further toward the next support level 2.4300 (monthly low from January and the target price for the completion of the active ABC correction (ii)).

The FxPro Tech Analysis Team

The FxPro technical experts prepare a daily analysis of the most active currency pairs (majors, crosses, exotics) and commodities. Selected instruments are reviewed on daily trends (D1, H4), using the active Elliott Wave setups, Japanese candlesticks, indicators, and support/resistance levels.

Share
Published by
The FxPro Tech Analysis Team
Tags: NTGUSD

Recent Posts

Pro News Weekly: Market Shake-Up, Dollar Drops, Gold Surges, Bitcoin Wobbles!

Welcome to Pro News Flash! 💵 The U.S. dollar slips 🏆 Major stock indices struggle…

5 hours ago

Solana Wave Analysis – 5 December 2025

Solana: ⬇️ Sell - Solana reversed from resistance zone - Likely to fall to support…

6 hours ago

EURAUD Wave Analysis – 5 December 2025

EURAUD : ⬇️ Sell - EURAUD broke the support level 1.7600 - Likely to fall…

6 hours ago

Forex has set its priorities

In 2026, experts favour the yen, see modest euro growth, and expect pressure on the…

10 hours ago

Bear market rebound in crypto is likely to continue

Crypto rebounds continue; Bitcoin faces resistance, with a mixed market outlook ahead, as regulatory changes…

11 hours ago

Coca-Cola Wave Analysis – 4 December 2025

Coca-Cola: ⬇️ Sell - Coca-Cola reversed from long-term resistance level 73.25 - Likely to fall to…

1 day ago

This website uses cookies