Categories: Technical analysis

Natural Gas Wave Analysis – 14 November , 2018

  • Natural Gas rising inside sharp impulse wave (5)
  • Further gains are likely

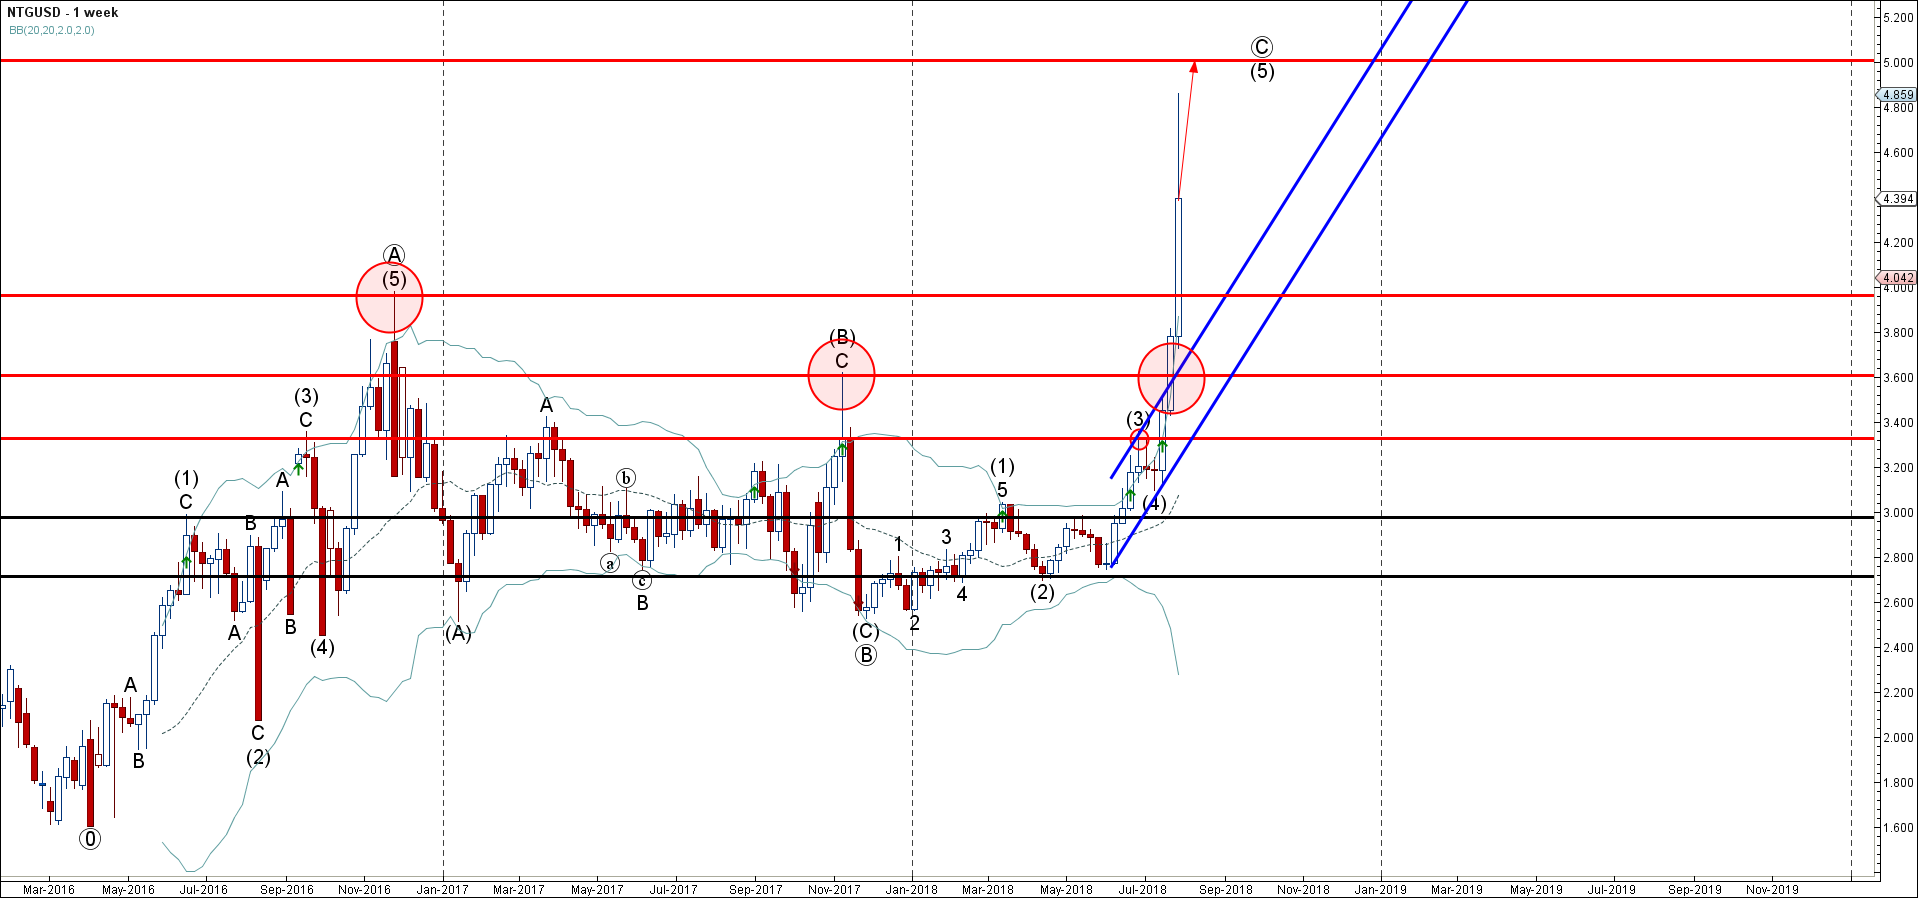
Natural Gas has been rising sharply in the last few trading sessions – breaking through two major resistance levels – 3.600 (yearly high from 2018) and 4.000 (yearly high from 2017).

The breakout of these resistance levels greatly accelerated the active impulse wave (5) belongs to the long-term impulse wave Ⓒ from the end of last year.

Natural Gas is expected to rise further and re-test the next major resistance level 5.000 (target price for the completion of the active impulse wave Ⓒ).

The FxPro Tech Analysis Team

The FxPro technical experts prepare a daily analysis of the most active currency pairs (majors, crosses, exotics) and commodities. Selected instruments are reviewed on daily trends (D1, H4), using the active Elliott Wave setups, Japanese candlesticks, indicators, and support/resistance levels.

Share
Published by
The FxPro Tech Analysis Team
Tags: NTGUSD

Recent Posts

Fed’s hawkish tone risks sinking S&P500 to 4700 

Bears showed strength ahead of the FOMC decision.  U.S. indices sagged on Tuesday as investors…

58 mins ago

A new stage of Bitcoin’s decline

Market Picture  Bitcoin's closing price on Tuesday became the lowest since late February, confirming the…

4 hours ago

Ebay Wave Analysis 30 April 2024

- Ebay under the bearish pressure - Likely to fall to support level 51.00 Ebay…

18 hours ago

GBPAUD Wave Analysis 30 April 2024

- GBPAUD reversed from key support level 1.9135 - Likely to rise to resistance level…

18 hours ago

Silver: a possible long road down

Silver has lost 2.6% since the start of the day on Tuesday to $26.4 per…

21 hours ago

Another Dip in Crypto Capitalization

Market picture  The crypto market capitalisation decreased by another 1.5% to $2.27 trillion, getting closer…

1 day ago

This website uses cookies