Categories: Technical analysis

Natural Gas Wave Analysis – 12 March 2025

Natural gas: ⬇️ Sell

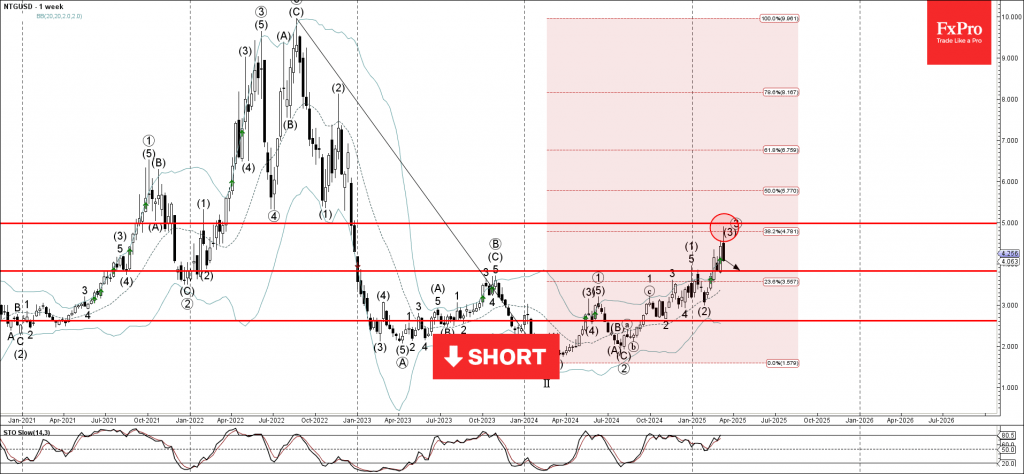
– Natural gas reversed from round resistance level 5.0000

– Likely to fall to support level 3.815

Natural gas recently reversed from the resistance area between the round resistance level 5.0000, the upper weekly Bollinger Band and the 38.2% Fibonacci correction of the downward impulse from 2022.

The downward reversal from this resistance area stopped the earlier weekly upward impulse sequence (3) from the start of 2025.

Given the recent formation of the daily Shooting Star and the overbought weekly Stochastic, Natural gas can be expected to fall to the next support level 3.815.

The FxPro Tech Analysis Team

The FxPro technical experts prepare a daily analysis of the most active currency pairs (majors, crosses, exotics) and commodities. Selected instruments are reviewed on daily trends (D1, H4), using the active Elliott Wave setups, Japanese candlesticks, indicators, and support/resistance levels.

Share
Published by
The FxPro Tech Analysis Team
Tags: natural Gas

Recent Posts

Geopolitics will destroy the euro

•    EURUSD falls due to geopolitics and expectations of tariff removal •    Gold returns to…

3 hours ago

Platinum Wave Analysis – 8 January 2026

Platinum: ⬇️ Sell - Platinum reversed from pivotal resistance level 150.00 - Likely to fall to…

16 hours ago

Baidu Wave Analysis – 8 January 2026

Baidu: ⬇️ Sell - Baidu reversed from resistance zone - Likely to fall to support level…

16 hours ago

EURUSD Wave Analysis – 8 January 2026

EURUSD: ⬇️ Sell - EURUSD broke daily up channel - Likely to fall to support…

17 hours ago

WTI crude oil Wave Analysis – 8 January 2026

WTI crude oil: ⬆️ Buy - WTI crude oil reversed from support zone - Likely…

17 hours ago

Do not underestimate dollar

Positive macro statistics for the US are helping the greenback. Gold could rise to $4,610…

1 day ago

This website uses cookies