Categories: Technical analysis

Natural gas Wave Analysis – 11 February 2025

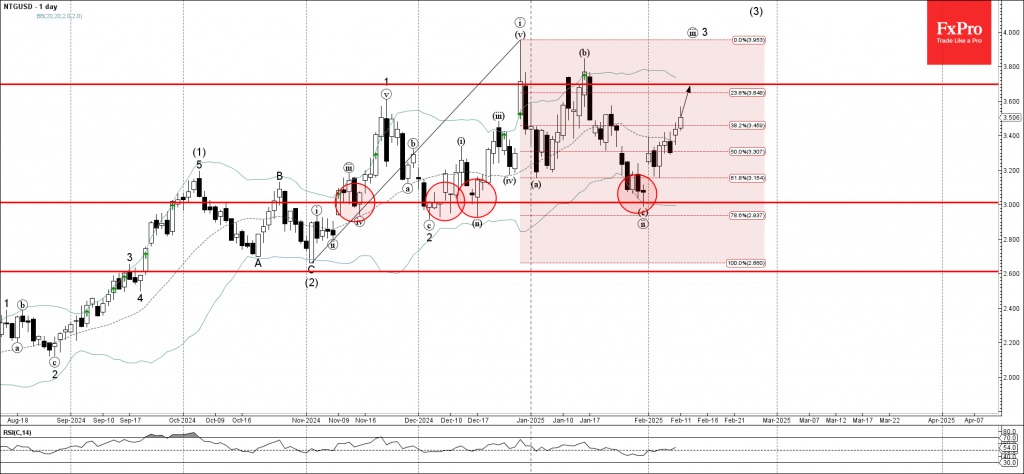
– Natural gas reversed from the support area

– Likely to rise to the resistance level 3.67

Natural gas continues to rise strongly inside the short-term upward impulse wave iii, which started earlier from the support area located between the round support level 3.0000 (which has been steadily reversing the price from November) and the lower daily Bollinger Band.

The upward reversal from this support area created the daily upward gap – which signals the strength of this support area.

Given the clear daily uptrend, Natural gas can be expected to rise to the next resistance level 3.67 (which has been reversing the price from December).

AddThis Website Tools
The FxPro Tech Analysis Team

The FxPro technical experts prepare a daily analysis of the most active currency pairs (majors, crosses, exotics) and commodities. Selected instruments are reviewed on daily trends (D1, H4), using the active Elliott Wave setups, Japanese candlesticks, indicators, and support/resistance levels.

Share
Published by
The FxPro Tech Analysis Team

Recent Posts

Apple Wave Analysis – 16 April 2025

Apple: ⬇️ Sell - Apple reversed from resistance level 210.00 - Likely to fall to…

8 hours ago

AUDCAD Wave Analysis – 16 April 2025

AUDCAD: ⬇️ Sell - AUDCAD reversed from resistance zone - Likely to fall to support…

9 hours ago

US sales jump gives USD relief, but is driven by fears

US Total retail sales rose 1.4% in March, beating the expected 1.3% after rising 0.2%…

16 hours ago

Tariff news and resistance zone put pressure on crypto

The crypto market capitalisation decreased by 2.6% in 24 hours due to the announcement of…

19 hours ago

Gold Wave Analysis – 16 April 2025

Gold: ⬆️ Buy - Gold broke resistance zone - Likely to rise to the resistance…

23 hours ago

GBPUSD Wave Analysis – 16 April 2025

GBPUSD: ⬆️ Buy - GBPUSD broke key resistance level 1.3200 - Likely to rise to…

23 hours ago