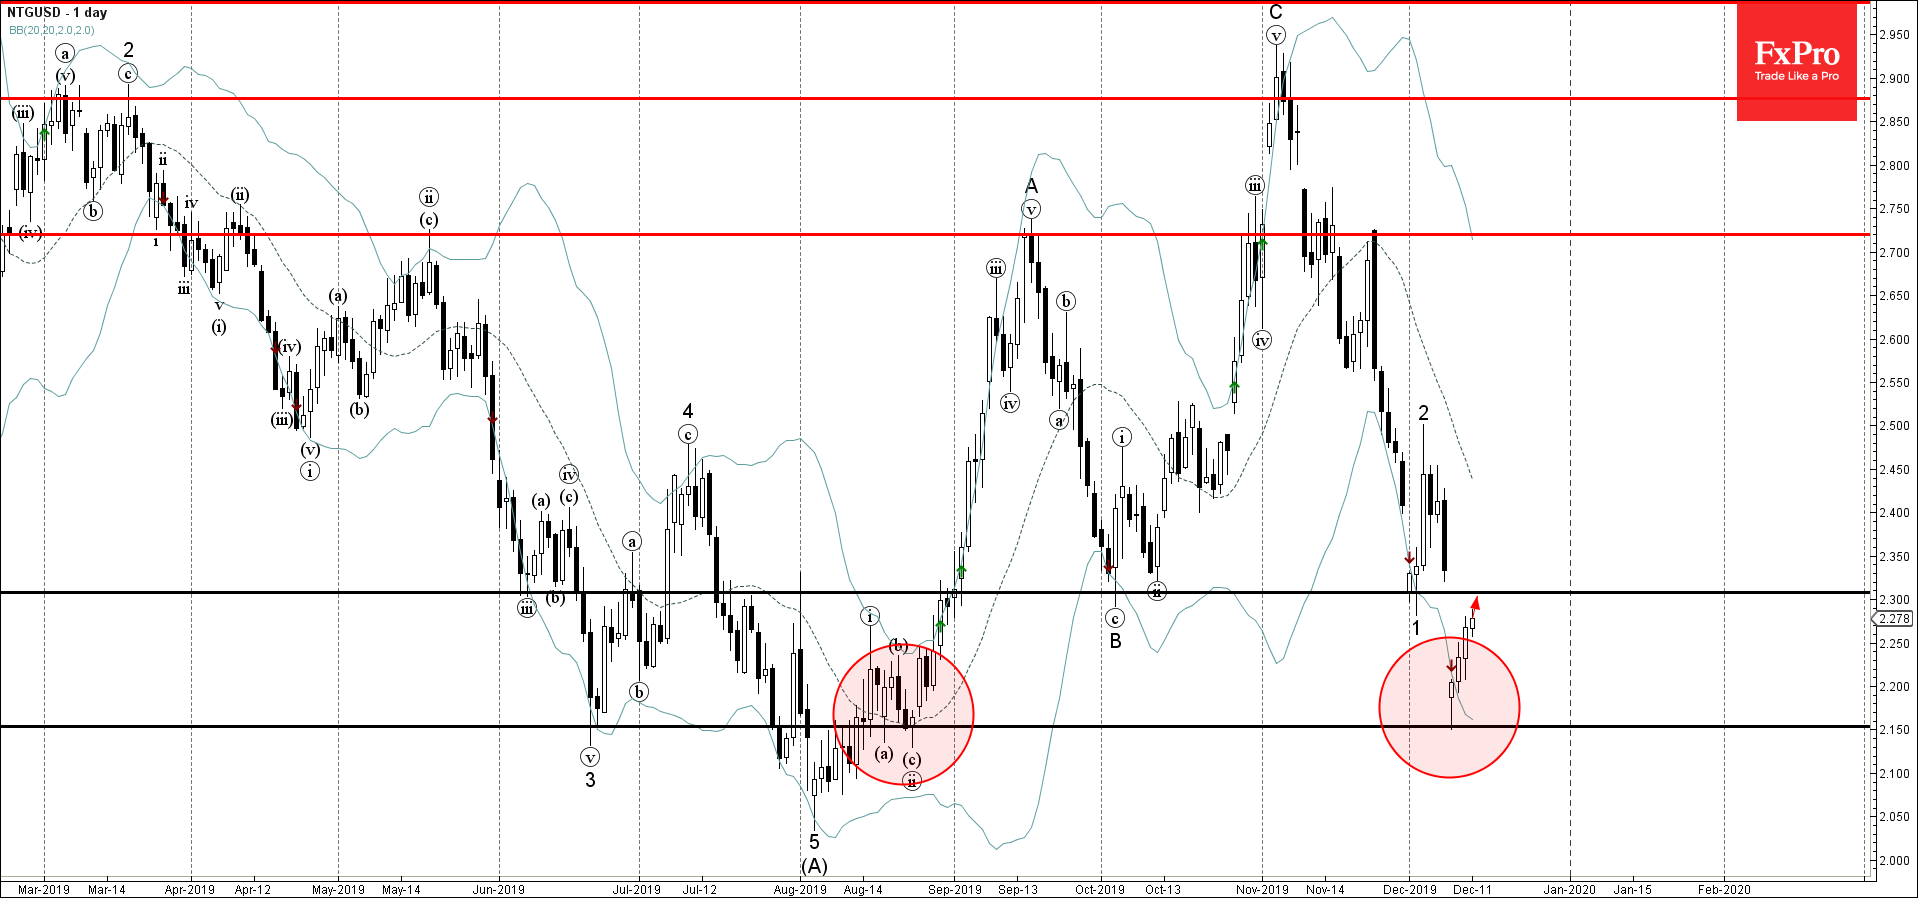
- Natural Gas reversed from support area
- Likely to rise to 2,300
Natural Gas recently reversed up from the support area lying between the key support level 2,150 (which reversed earlier waves (a) and (c) in August) and the lower daily Bollinger Band.
The upward reversal from this support area created the daily Japanese candlesticks reversal pattern Hammer.
Natural Gas is expected to rise further toward the next resistance level 2,300 (former strong support level, which stopped earlier waves B and 1).