Categories: Technical analysis

Natural Gas Wave Analysis – 10 June 2025

Natural Gas: ⬇️ Sell

– Natural Gas reversed from key resistance level 3.80

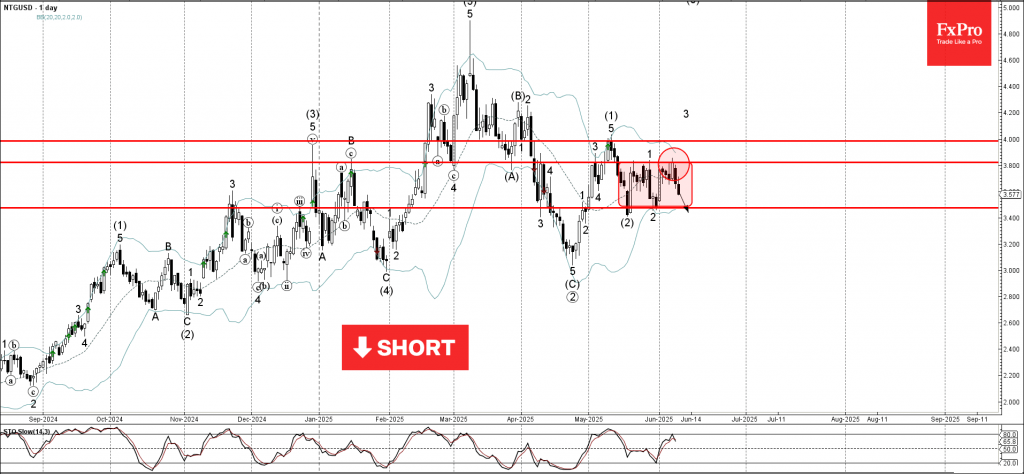
– Likely to fall to support level 3.50

Natural Gas recently reversed down from the pivotal resistance level 3.80 (which is the upper border of the narrow sideways price range inside which the price has been trading from May).

The downward reversal from the resistance level 3.80 created the daily Japanese candlesticks reversal pattern Bearish Engulfing.

Given the strong daily downtrend, Natural Gas can be expected to fall to the next support level 3.50 (lower border of the active price range, low of waves (2) and 2).

The FxPro Tech Analysis Team

The FxPro technical experts prepare a daily analysis of the most active currency pairs (majors, crosses, exotics) and commodities. Selected instruments are reviewed on daily trends (D1, H4), using the active Elliott Wave setups, Japanese candlesticks, indicators, and support/resistance levels.

Share
Published by
The FxPro Tech Analysis Team
Tags: natural Gas

Recent Posts

Do not underestimate dollar

Positive macro statistics for the US are helping the greenback. Gold could rise to $4,610…

4 hours ago

Crypto fails to find support for a breakout

Crypto markets fell amid caution; Bitcoin and Ethereum face technical and investor shifts, with privacy…

5 hours ago

SP500. Current situation #sp500 #tradelikeapro #trading #trandingshorts #tradingstrategy #fxpro

Today is Thursday, January 8th, and we continue talking about the markets. Today, we will…

6 hours ago

NZDCAD Wave Analysis – 7 January 2026

NZDCAD: ⬆️ Buy - NZDCAD reversed from support zone - Likely to rise to resistance…

19 hours ago

Bitcoin Wave Analysis – 7 January 2026

Bitcoin: ⬇️ Sell - Bitcoin reversed from resistance zone - Likely to fall to support…

19 hours ago

EURGBP Wave Analysis – 7 January 2026

EURGBP: ⬆️ Buy - EURGBP reversed from support zone - Likely to rise to resistance…

19 hours ago

This website uses cookies