Categories: Technical analysis

Natural gas Wave Analysis 10 April 2024

– Natural gas reversed from key resistance level 2.035

– Likely to fall to support level 1.860

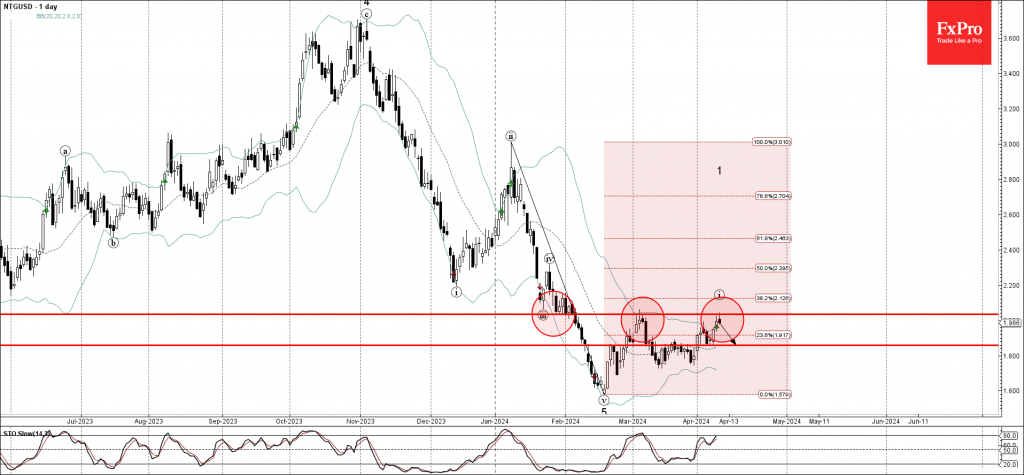
Natural gas recently reversed down from the key resistance level 2.035 (former strong support from the end of January and the monthly high from March).

The downward reversal from the resistance level 2.035 stopped the previous minor impulse wave i.

Given the strength of the resistance level 2.035, prevailing downtrend and the overbought daily Stochastic, Natural gas can be expected to fall further to the next support level 1.860 (low of the morning star from the start of this month).

AddThis Website Tools
The FxPro Tech Analysis Team

The FxPro technical experts prepare a daily analysis of the most active currency pairs (majors, crosses, exotics) and commodities. Selected instruments are reviewed on daily trends (D1, H4), using the active Elliott Wave setups, Japanese candlesticks, indicators, and support/resistance levels.

Share
Published by
The FxPro Tech Analysis Team

Recent Posts

Tesla Wave Analysis – 21 March 2025

Tesla: ⬆️ Buy - Tesla reversed from support level 220.00 - Likely to rise to…

19 hours ago

Google Wave Analysis – 21 March 2025

Google: ⬆️ Buy - Google reversed from key support level 160.00 - Likely to rise…

19 hours ago

Silver Wave Analysis – 21 March 2025

Silver: ⬇️ Sell - Silver reversed from resistance level 34.00 - Likely to fall to…

21 hours ago

USDCHF Wave Analysis – 21 March 2025

USDCHF: ⬆️ Buy - USDCHF reversed from support level 0,8750 - Likely to fall to…

21 hours ago

What’s next: Flash PMIs, UK CPI & US PCE

The week ahead includes the release of the PMI business activity indexes for March, the…

1 day ago

Gold: Growth Opportunities

Gold has been in an uptrend, reaching record highs and offering growth opportunities. However, caution…

1 day ago