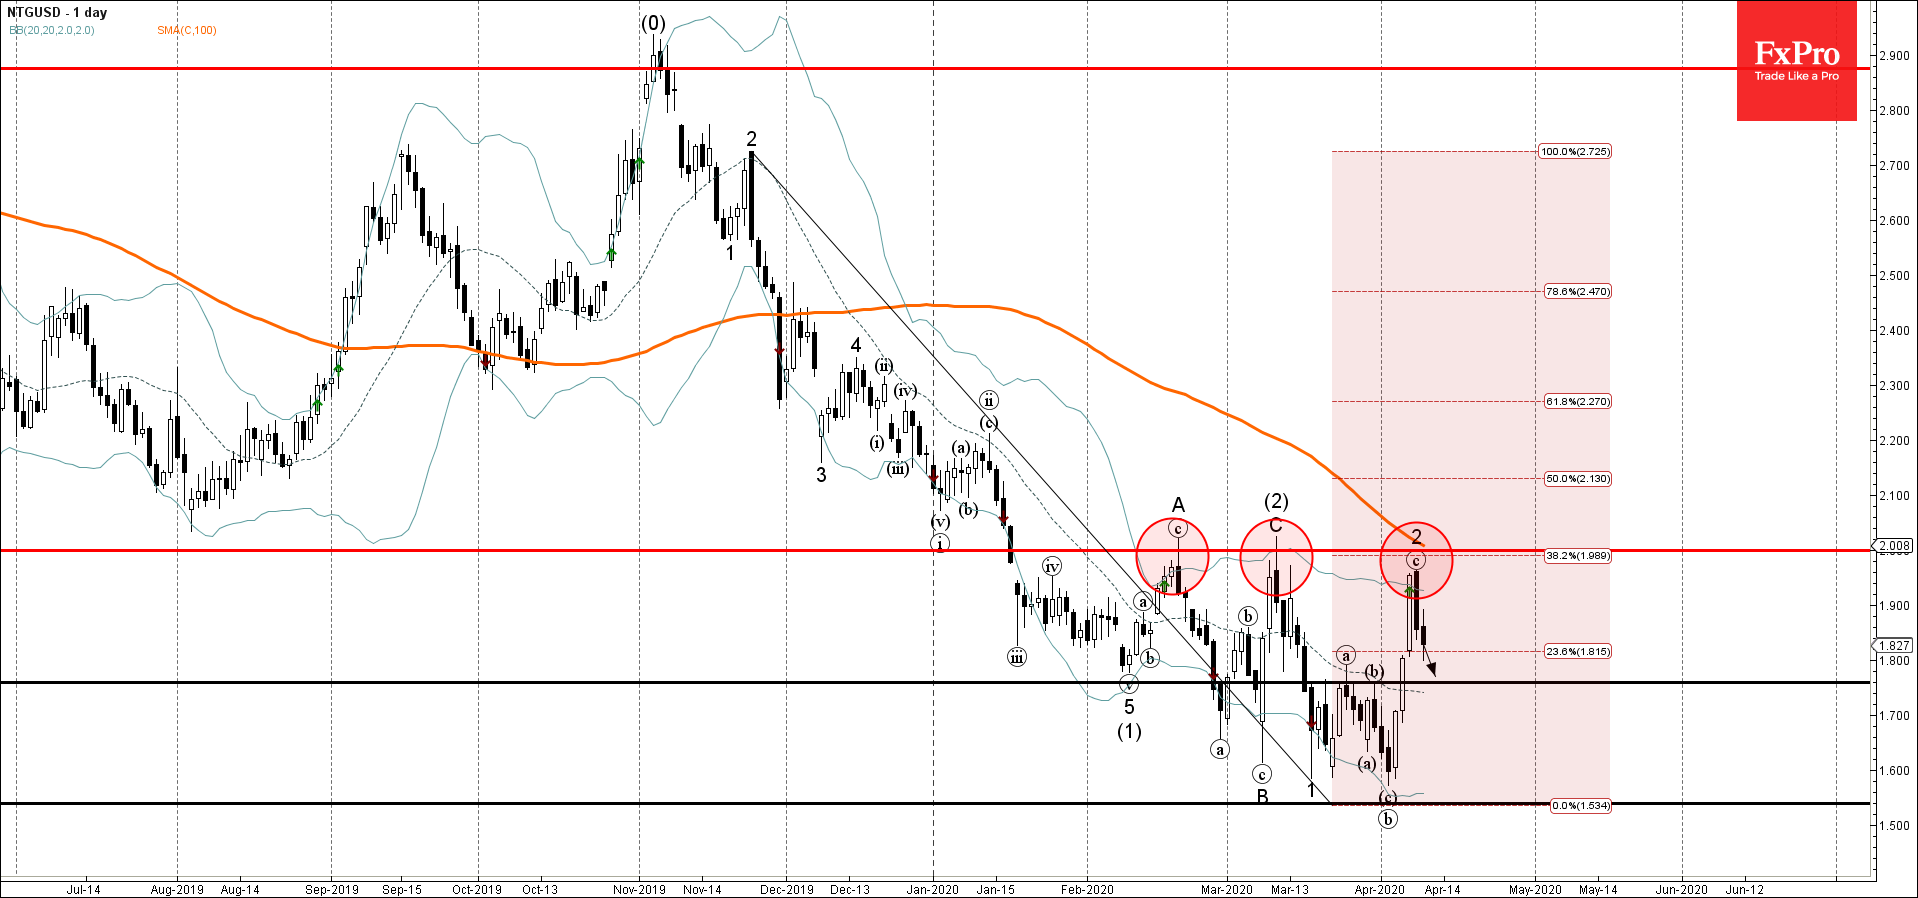
- Natural Gas reversed from round resistance level 2,000
- Likely to fall to 1.758
Natural Gas recently reversed down from the round resistance level 2,000, intersecting with the 100-day moving average, upper daily Bollinger Band and the 38.2% Fibonacci correction of the downward impulse from November.
This downward reversal created the daily Japanese candlesticks reversal pattern Bearish Engulfing.
Natural Gas is likely to fall further toward the next support level 1.758 (former strong resistance level from the end of March, which stopped waves (a) and (b)).