Categories: Technical analysis

Natural Gas Wave Analysis – 07 May, 2019

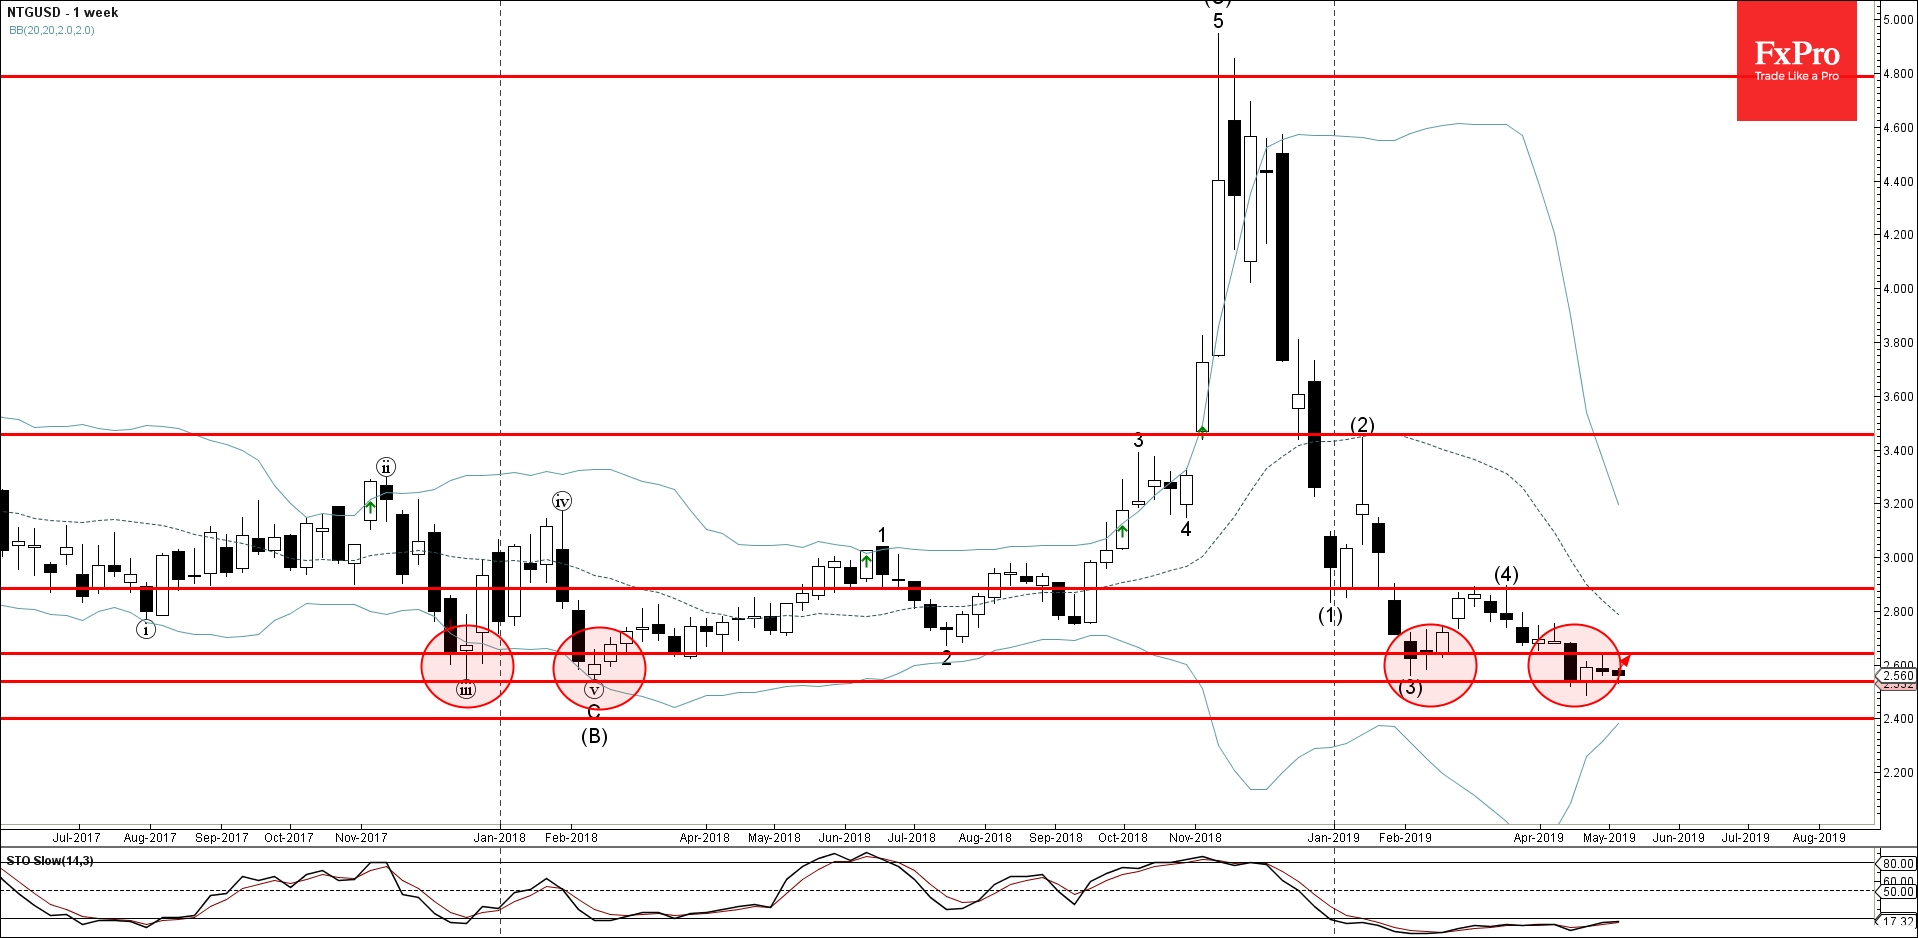
  • Natural Gas reversed from support area
  • Further gains are likely

Natural Gas recently reversed up from the support area lying between the multi-month  support level 2.540 and the lower weekly Bollinger Band.

The upward reversal from this support area stopped the previous medium-term impulse wave (5) from March.

Given the oversold reading on the weekly Stochastic indicator – Natural Gas is expected to rise further and re-test the next resistance level 2.643.

The FxPro Tech Analysis Team

The FxPro technical experts prepare a daily analysis of the most active currency pairs (majors, crosses, exotics) and commodities. Selected instruments are reviewed on daily trends (D1, H4), using the active Elliott Wave setups, Japanese candlesticks, indicators, and support/resistance levels.

Share
Published by
The FxPro Tech Analysis Team
Tags: NTGUSD

Recent Posts

Solana Wave Analysis – 18 March 2025

Solana: ⬇️ Sell - Solana reversed from the resistance zone - Likely to fall to…

1 hour ago

CHFJPY Wave Analysis – 18 March 2025

CHFJPY: ⬆️ Buy - CHFJPY broke resistance zone - Likely to rise to resistance level…

1 hour ago

The crypto market is stuck in the mud

Market Picture The crypto market has been hovering in a narrow range for the past…

6 hours ago

FTSE 100 Wave Analysis – 17 March 2025

FTSE 100: ⬆️ Buy - FTSE 100 reversed from key support level 8425.00 - Likely…

22 hours ago

Alibaba Wave Analysis – 17 March 2025

Alibaba: ⬆️ Buy - Alibaba broke the key resistance level 145.00 - Likely to rise…

22 hours ago

EURNZD Wave Analysis – 17 March 2025

EURNZD: ⬇️ Sell - EURNZD reversed from long-term resistance level 1.9160 - Likely to fall…

1 day ago

This website uses cookies