Categories: Technical analysis

Natural Gas Wave Analysis – 04 March, 2020

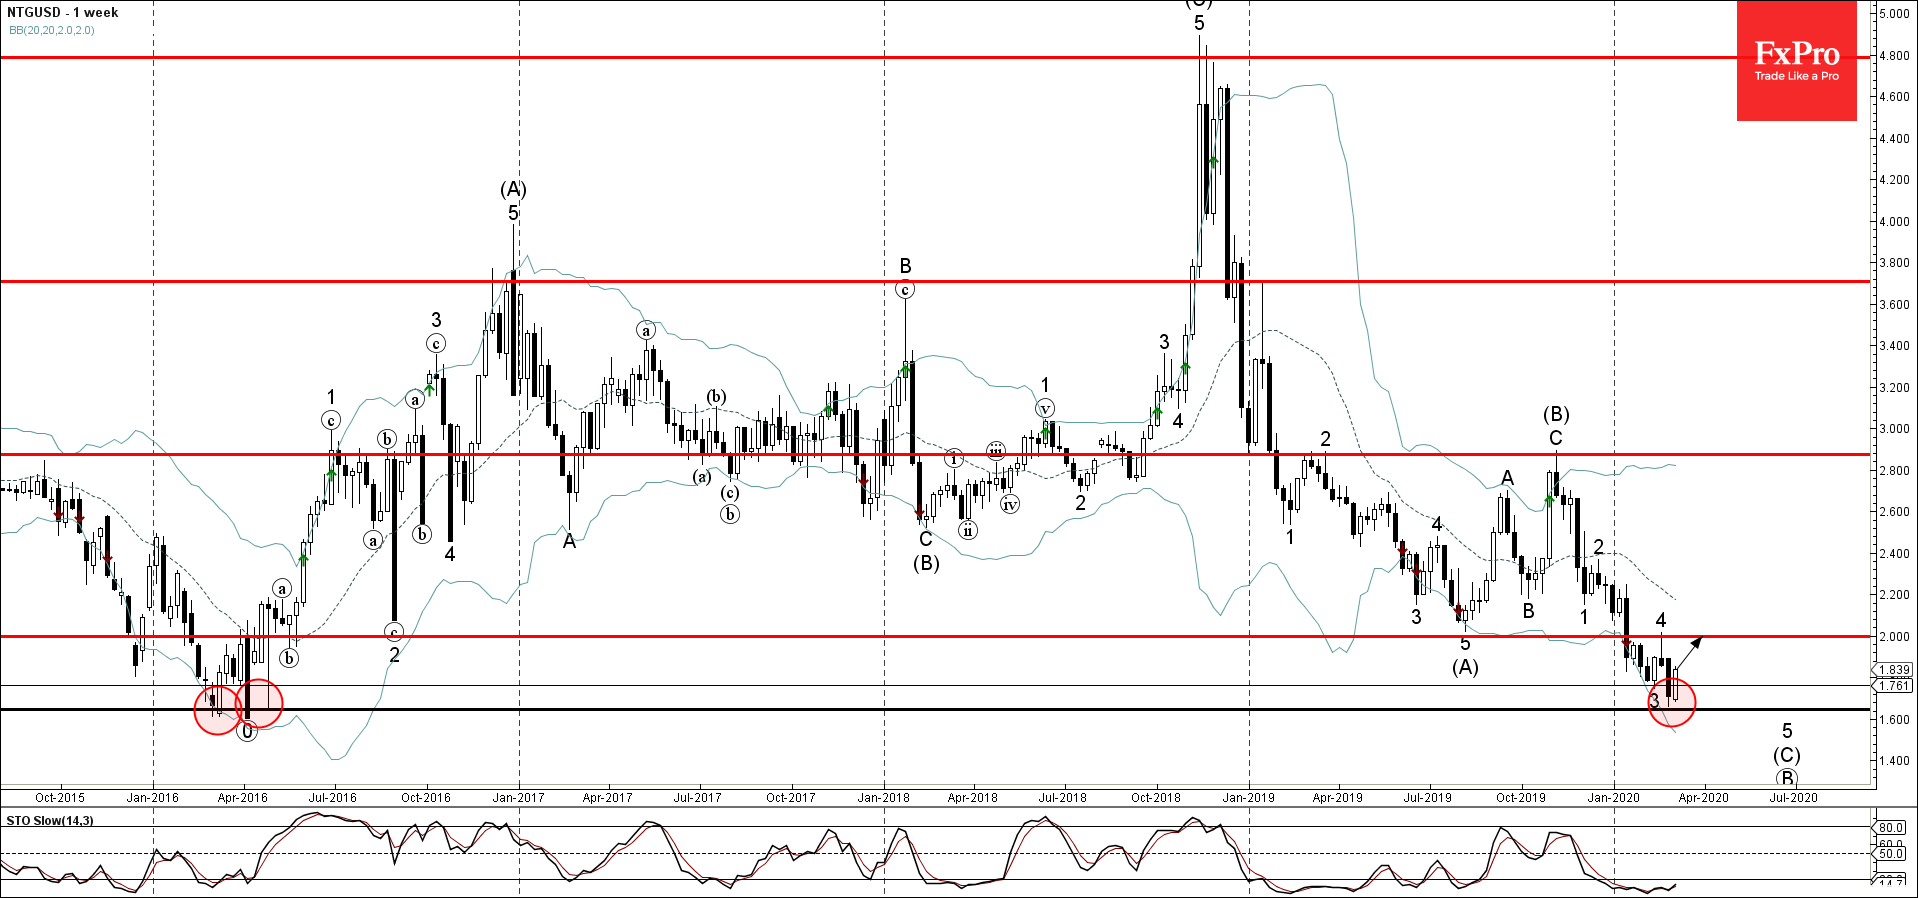
  • Natural Gas reversed from long-term support area
  • Likely to rise to 2.00

Natural Gas recently reversed up from the long-term support area lying at the intersection of the multi-year support level 1.6440 (which started the sharp weekly uptrend in 2106) and the lower weekly Bollinger Band.

The upward reversal from this support area stopped the previous short-term impulse wave 5.

Given the oversold weekly Stochastic – Natural Gas is likely to rise further toward the next round resistance level 2.00 (former yearly low from 2019 and the top of the previous correction 4).

The FxPro Tech Analysis Team

The FxPro technical experts prepare a daily analysis of the most active currency pairs (majors, crosses, exotics) and commodities. Selected instruments are reviewed on daily trends (D1, H4), using the active Elliott Wave setups, Japanese candlesticks, indicators, and support/resistance levels.

Share
Published by
The FxPro Tech Analysis Team
Tags: NTGUSD

Recent Posts

Nikkei 225 index Wave Analysis 20 September 2024

- Nikkei 225 index rising inside minor impulse waves 3 - Likely to reach resistance…

7 hours ago

NZDJPY Wave Analysis 20 September 2024

- NZDJPY rising inside corrective wave ii - Likely to rise to resistance level 91.65…

7 hours ago

Gold terminates the last sceptics

Gold started the week with new highs and ended the week up 1.3%, despite a…

13 hours ago

The Crypto Market’s Steady Ascent

Crypto market cap rose by 3.2% to $2.21 trillion overnight. This made the struggle to…

19 hours ago

Gold Wave Analysis 19 September 2024

- Gold reversed from support level 2550.00 - Likely to rise to resistance level 2600.00…

1 day ago

S&P 500 Wave Analysis 19 September 2024

- S&P 500 broke key resistance level 5670.00 - Likely to rise to resistance level…

1 day ago

This website uses cookies