Categories: Technical analysis

Natural Gas rising inside impulse wave (iii)

  • Natural Gas rising inside impulse wave (iii)
  • Further gains are likely

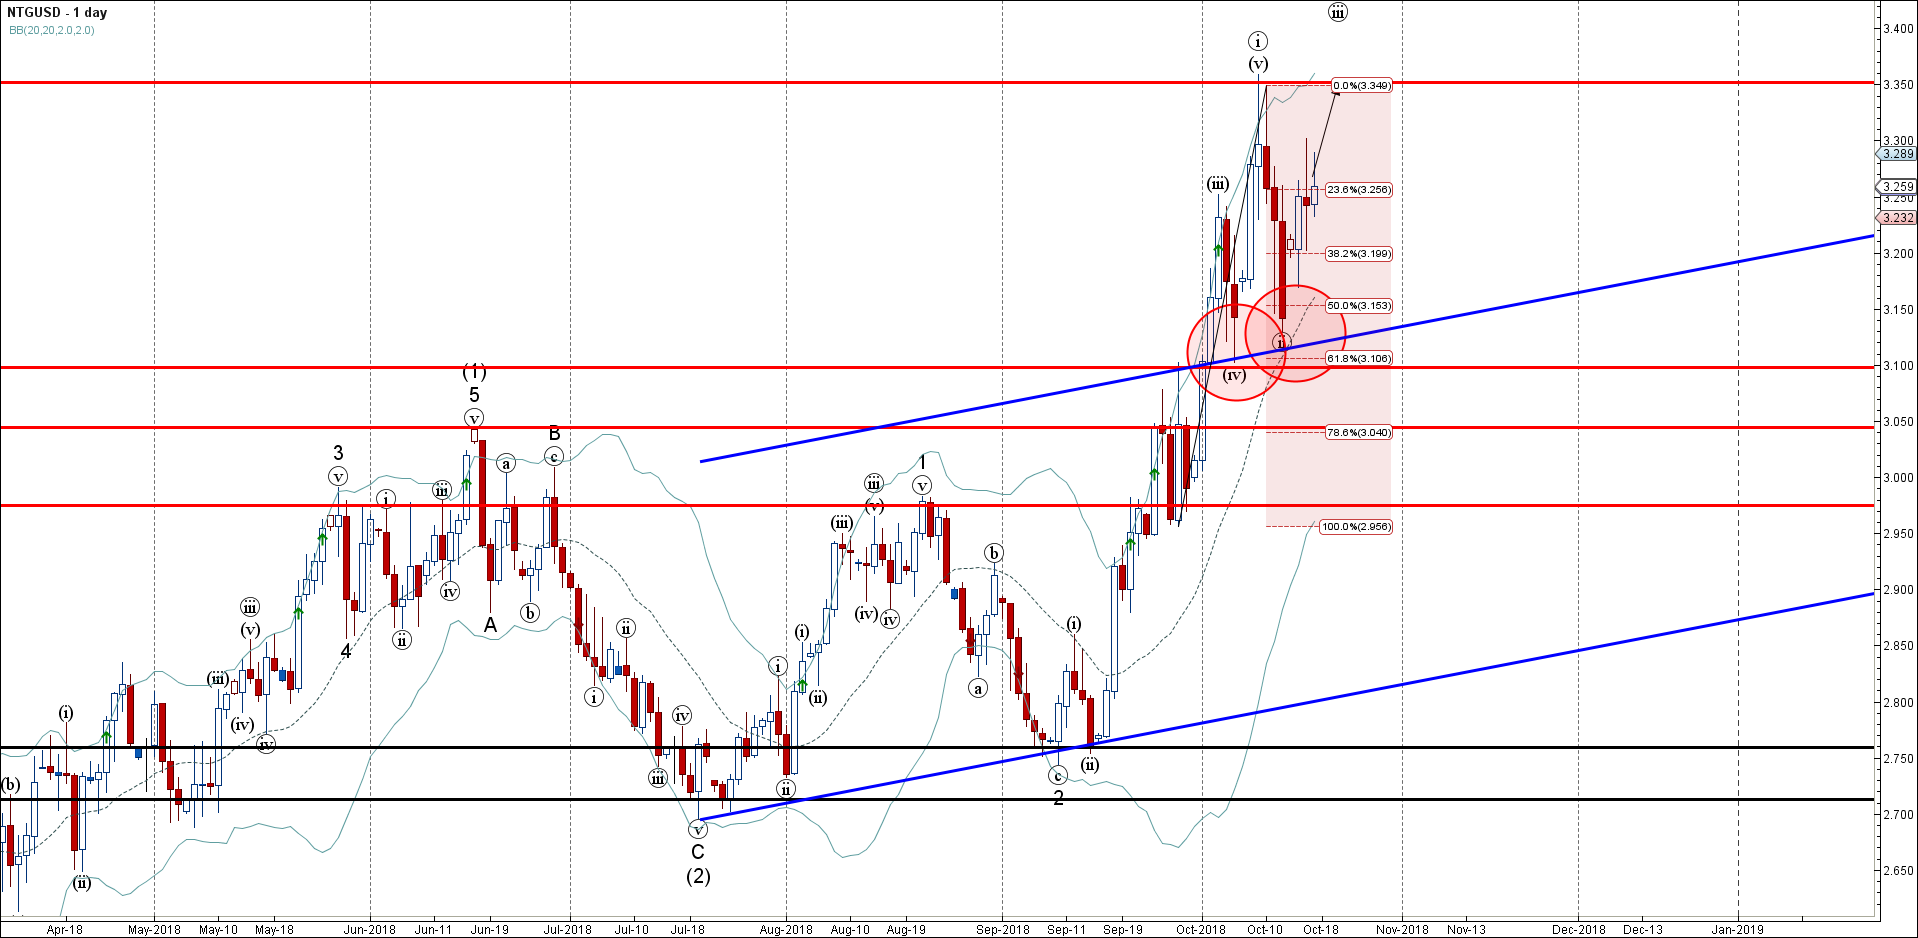
Natural Gas continues to rise inside the short-term impulse wave (iii), which started earlier from the support area located between the key support level 3.100 (which also reversed the previous wave (iv)), upper trendline of the recently broken daily up channel from July and the 61.8% Fibonacci correction of the upward impulse from September.

The active impulse wave (iii) belongs to the impulse 3 of the medium-term impulse wave (3) from the middle of July.

Natural Gas is expected to rise further and re-test the next strong resistance level 3.350 (which stopped the previous impulse wave (i)).

AddThis Website Tools
The FxPro Tech Analysis Team

The FxPro technical experts prepare a daily analysis of the most active currency pairs (majors, crosses, exotics) and commodities. Selected instruments are reviewed on daily trends (D1, H4), using the active Elliott Wave setups, Japanese candlesticks, indicators, and support/resistance levels.

Share
Published by
The FxPro Tech Analysis Team
Tags: NTGUSD

Recent Posts

Apple Wave Analysis – 20 March 2025

Apple: ⬇️ Sell - Apple reversed from resistance level 220.00 - Likely to fall to…

3 hours ago

IBM Wave Analysis – 20 March 2025

IBM: ⬆️ Buy - IBM reversed from support zone - Likely to rise to resistance…

3 hours ago

AUDNZD Wave Analysis – 20 March 2025

AUDNZD: ⬆️ Buy - AUDNZD reversed from key support level 1.0930 - Likely to rise…

6 hours ago

EURCAD Wave Analysis – 20 March 2025

EURCAD: ⬇️ Sell - EURCAD reversed from the resistance zone - Likely to fall to…

6 hours ago

Crypto Market Testing Resistance

The crypto market has increased by over 5% and is nearing the $2.9 trillion. The…

11 hours ago

Gold Wave Analysis – 19 March 2025

Gold: ⬆️ Buy - Gold continues daily uptrend - Likely to rise to resistance level…

1 day ago