• Natural gas falling inside short-term correction (iv).
• Likely to reach 2.900
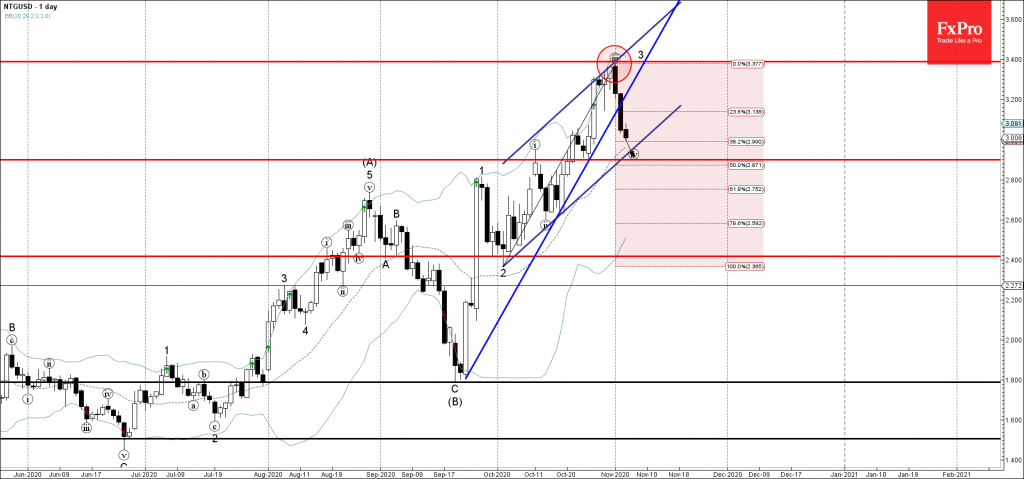
Natural gas recently reversed down from the key resistance level 3.40, intersecting with the upper daily Bollinger Band and the resistance trendline of the daily up channel from last month.
The downward reversal from the resistance level 3.40 created the daily reversal pattern Bearish Engulfing – which started the active short-term correction (iv).
Having recently broken the sharp support trendline from September – Natural gas is likely to fall further toward the next support level 2.900 (former support from October and the target for the completion of the active correction (iv)).