Categories: Technical analysis

Nasdaq-100 Wave Analysis – 4 April 2023

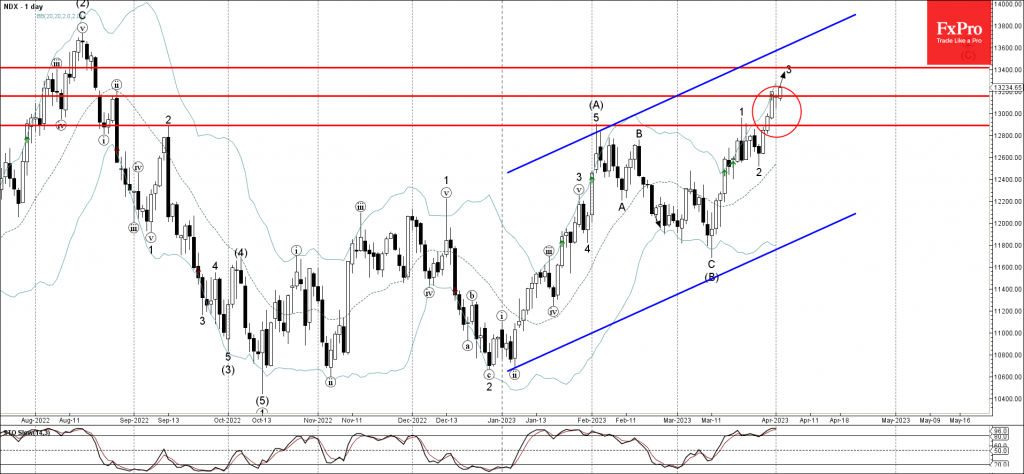
• Nasdaq-100 broke resistance area

• Likely to rise to resistance level 13400.00

Nasdaq-100 index recently broke the resistance area located between the resistance levels 12885.00 (which has been reversing the price from the start of February) and 13160.00

The breakout of this resistance area accelerated the active impulse wave 3 of the intermediate impulse wave (C) from last month.

Given the clear daily uptrend, Nasdaq-100 index can then be expected to rise further toward the next resistance level 13400.00 (target price for the completion of the active impulse wave 3).

The FxPro Tech Analysis Team

The FxPro technical experts prepare a daily analysis of the most active currency pairs (majors, crosses, exotics) and commodities. Selected instruments are reviewed on daily trends (D1, H4), using the active Elliott Wave setups, Japanese candlesticks, indicators, and support/resistance levels.

Share
Published by
The FxPro Tech Analysis Team
Tags: nasdaq

Recent Posts

ANF Wave Analysis 29 April 2024

ANF reversed from key support level 113.40 Likely to rise to resistance level 132.31 ANF…

2 hours ago

GBPUSD Wave Analysis 29 April 2024

- GBPUSD rising inside minor correction 2 - Likely to rise to resistance level 1.2700…

2 hours ago

Crypto Market Retreats Due to Overhang of Sellers

Market picture The crypto market has lost 3.3% in the last 24 hours to $2.3…

12 hours ago

USDJPY Wave Analysis 26 April 2024

- USDJPY broke key resistance level 155.00 - Likely to rise to resistance level 160.00…

3 days ago

Ebay Wave Analysis 26 April 2024

- Ebay reversed from support level 49.35 - Likely to rise to resistance level 52.55…

3 days ago

False Alert with Yen Interventions?

Even though the Bank of Japan left the key rate and parameters of the QE…

3 days ago

This website uses cookies