Categories: Technical analysis

Nasdaq-100 Wave Analysis – 29 October 2025

Nasdaq-100: ⬆️ Buy

– Nasdaq-100 broke resistance area

– Likely to rise to resistance level 27000.00

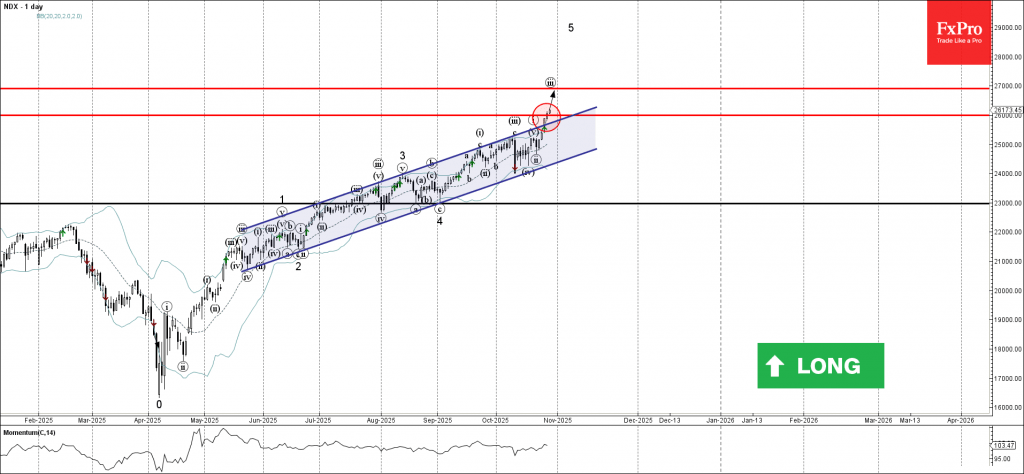
Nasdaq-100 index recently broke the resistance area between the resistance level 26000.00 and the resistance trendline of the extended daily up channel from May.

The breakout of this resistance area accelerated the active short-term impulse wave iii of the impulse wave 5 from the start of Septembers.

Given the strong daily uptrend and rising daily Momentum, Nasdaq-100 index can be expected to rise to the next resistance level 27000.00 (target price for the completion of the active impulse wave iii).

The FxPro Tech Analysis Team

The FxPro technical experts prepare a daily analysis of the most active currency pairs (majors, crosses, exotics) and commodities. Selected instruments are reviewed on daily trends (D1, H4), using the active Elliott Wave setups, Japanese candlesticks, indicators, and support/resistance levels.

Share
Published by
The FxPro Tech Analysis Team
Tags: nasdaq

Recent Posts

EURJPY Wave Analysis – 31 December 2025

EURJPY: ⬆️ Buy - EURJPY reversed from support area - Likely to rise to resistance…

2 days ago

Binance Coin Wave Analysis – 31 December 2025

Binance Coin: ⬆️ Buy - Binance Coin broke Descending Triangle - Likely to rise to…

2 days ago

Uniswap Wave Analysis – 31 December 2025

Uniswap: ⬇️ Sell - Uniswap reversed from resistance area - Likely to fall to support…

2 days ago

S&P 500 Wave Analysis – 31 December 2025

S&P 500: ⬇️ Sell - S&P 500 reversed from strong resistance level 6935.00 - Likely…

2 days ago

The dollar may defy expectations

•  The return of American exceptionalism will help the greenback. •  The yen will start…

2 days ago

Stellar Wave Analysis – 30 December 2025

Stellar: ⬇️ Sell - Stellar reversed from resistance area - Likely to fall to support…

2 days ago

This website uses cookies