Categories: Technical analysis

Nasdaq-100 Wave Analysis – 29 November, 2021

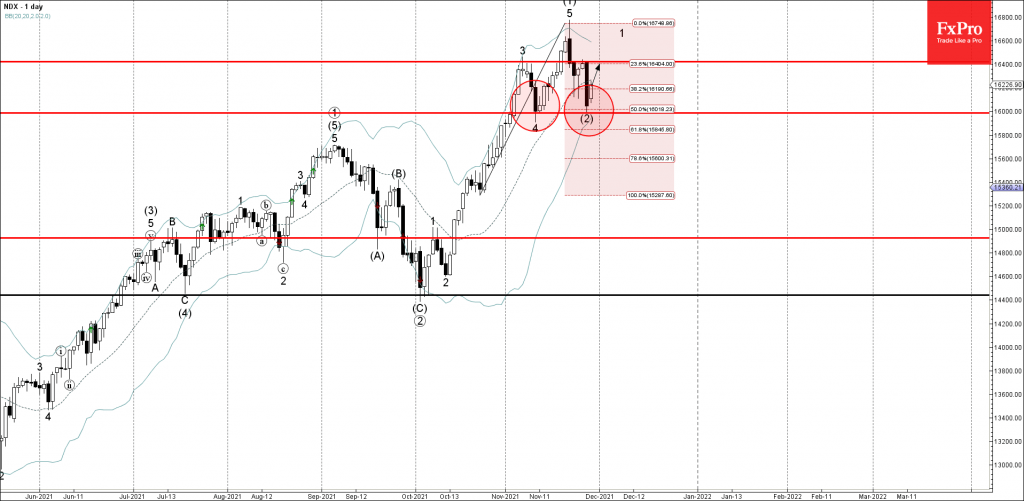
• Nasdaq-100 reversed from support level 16000.00

• Likely to rise to resistance level 16400.00


Nasdaq-100 index recently reversed up from the round support level 16000.00 (which has been reversing the price from the start of November August), intersecting with the lower daily Bollinger Band and the 50% Fibonacci correction of the upward impulse from October.

The upward reversal from the support level 16000.00 stopped the previous intermediate ABC correction (2).

Given the clear daily uptrend, Nasdaq-100 index can be expected to rise further toward the next resistance level 16400.00 (top of wave 3 from the start of this month).

The FxPro Tech Analysis Team

The FxPro technical experts prepare a daily analysis of the most active currency pairs (majors, crosses, exotics) and commodities. Selected instruments are reviewed on daily trends (D1, H4), using the active Elliott Wave setups, Japanese candlesticks, indicators, and support/resistance levels.

Share
Published by
The FxPro Tech Analysis Team
Tags: Nasdaq-100

Recent Posts

Brent Crude oil Wave Analysis – 13 January 2026

Brent Crude oil ⬆️ Buy - Brent Crude oil rising inside impulse wave c -…

6 hours ago

USDJPY Wave Analysis – 13 January 2026

USDJPY ⬆️ Buy - USDJPY broke resistance area - Likely to rise to resistance level…

6 hours ago

Exxon Mobil Wave Analysis – 13 January 2026

Exxon Mobil ⬆️ Buy - Exxon Mobil broke resistance level 125.60 - Likely to rise…

6 hours ago

BNB Wave Analysis – 13 January 2026

Brent Crude oil ⬆️ Buy - BNB broke out of sideways price range - Likely…

6 hours ago

A slightly weaker CPI was not enough to break through the highs

US CPI data a bit softer than forecasts, sparking brief market optimism, but resistance remains.…

11 hours ago

Pro News Flash: Global Tensions Fuel a Fresh Oil Rally

🛢️ Oil prices are finding fresh strength as geopolitical tensions in the Middle East reignite…

12 hours ago

This website uses cookies