Categories: Technical analysis

Nasdaq 100 Wave Analysis – 29 December, 2022

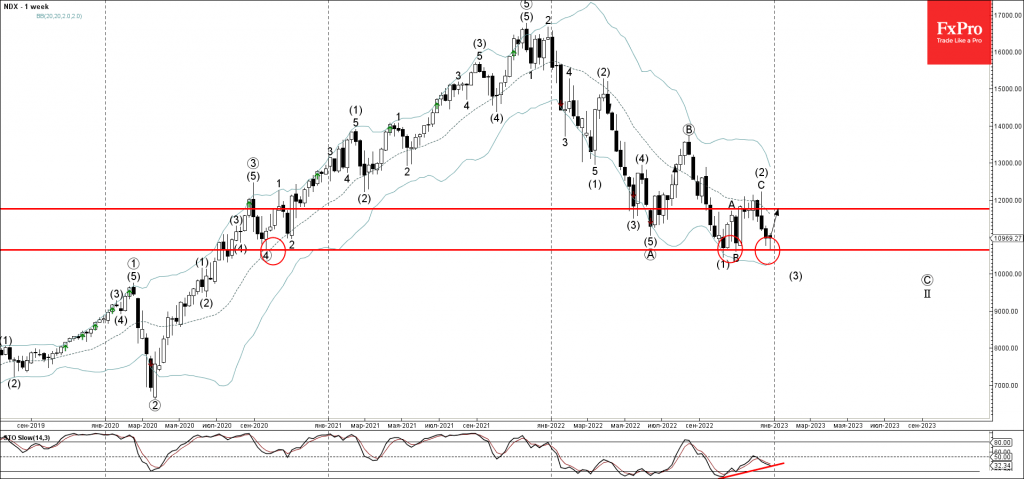
• Nasdaq 100 reversed from support level 10650.00

• Likely to rise to resistance level 12000

Nasdaq 100 index recently reversed up from the major support level 10650.00 (which has been repeatedly reversing the price from the middle of 2020).

The upward reversal from the support level 10650.00 stopped the previous intermediate impulse wave (3).

Given the clear bullish divergence on the weekly Stochastic indicator, Nasdaq 100 can be expected to rise further toward the next resistance level 12000.00.

The FxPro Tech Analysis Team

The FxPro technical experts prepare a daily analysis of the most active currency pairs (majors, crosses, exotics) and commodities. Selected instruments are reviewed on daily trends (D1, H4), using the active Elliott Wave setups, Japanese candlesticks, indicators, and support/resistance levels.

Share
Published by
The FxPro Tech Analysis Team
Tags: nasdaq

Recent Posts

Ebay Wave Analysis 30 April 2024

- Ebay under the bearish pressure - Likely to fall to support level 51.00 Ebay…

9 hours ago

GBPAUD Wave Analysis 30 April 2024

- GBPAUD reversed from key support level 1.9135 - Likely to rise to resistance level…

9 hours ago

Silver: a possible long road down

Silver has lost 2.6% since the start of the day on Tuesday to $26.4 per…

12 hours ago

Another Dip in Crypto Capitalization

Market picture  The crypto market capitalisation decreased by another 1.5% to $2.27 trillion, getting closer…

16 hours ago

ANF Wave Analysis 29 April 2024

ANF reversed from key support level 113.40 Likely to rise to resistance level 132.31 ANF…

1 day ago

GBPUSD Wave Analysis 29 April 2024

- GBPUSD rising inside minor correction 2 - Likely to rise to resistance level 1.2700…

1 day ago

This website uses cookies