Categories: Technical analysis

NASDAQ 100 Wave Analysis – 29 December, 2021

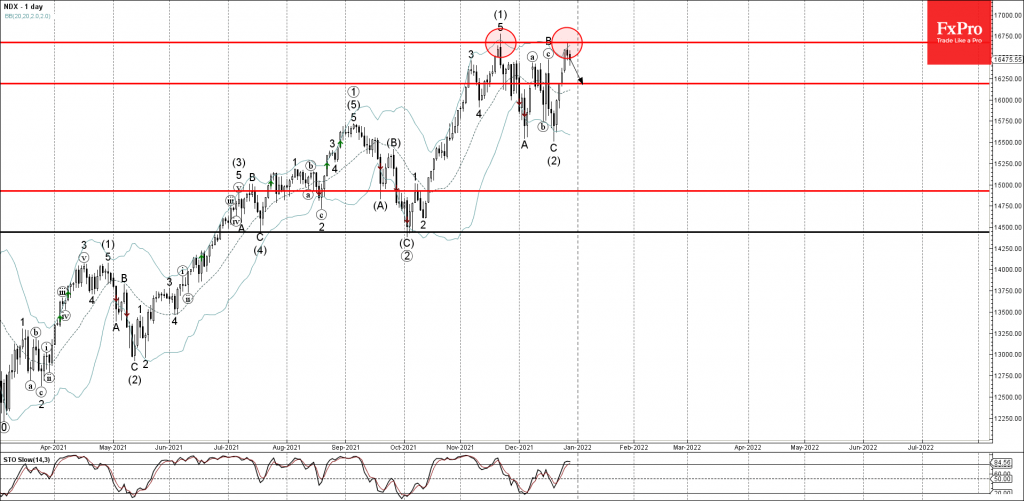
• NASDAQ 100 reversed from resistance level 16675.00

• Likely to fall to support level 16250.00

NASDAQ 100 index recently reversed down from the pivotal resistance level 16675.00 (which stopped the previous sharp upward impulse wave (1) the middle of November).

The resistance area near the resistance level 16675.00 was further strengthened by the upper daily Bollinger Band.

Given the strength of the resistance level 16675.00 and the overbought daily Stochastic, NASDAQ 100 index can be expected to fall further toward the next support level 16250.00.

The FxPro Tech Analysis Team

The FxPro technical experts prepare a daily analysis of the most active currency pairs (majors, crosses, exotics) and commodities. Selected instruments are reviewed on daily trends (D1, H4), using the active Elliott Wave setups, Japanese candlesticks, indicators, and support/resistance levels.

Share
Published by
The FxPro Tech Analysis Team
Tags: Nasdaq 100

Recent Posts

EURJPY Wave Analysis 2 May 2024

- EURJPY under strong bearish pressure - Likely to fall to support level 163.10 EURJPY…

7 hours ago

WTI crude oil Wave Analysis 2 May 2024

- WTI broke round support level 80.00 - Likely to fall to support level 76.00…

7 hours ago

ADP hints at another strong NFP on Friday

The monthly ADP labour market report showed that America created 192K new jobs in April, above…

1 day ago

Fed’s hawkish tone risks sinking S&P500 to 4700

Bears showed strength ahead of the FOMC decision.  U.S. indices sagged on Tuesday as investors…

2 days ago

A new stage of Bitcoin’s decline

Market Picture  Bitcoin's closing price on Tuesday became the lowest since late February, confirming the…

2 days ago

Ebay Wave Analysis 30 April 2024

- Ebay under the bearish pressure - Likely to fall to support level 51.00 Ebay…

2 days ago

This website uses cookies