Categories: Technical analysis

Nasdaq 100 Wave Analysis 23 December 2024

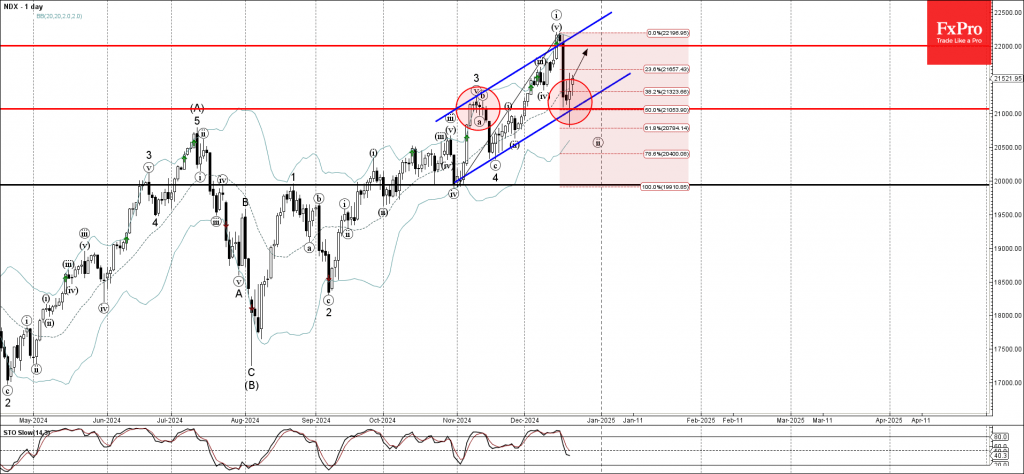
– Nasdaq 100 reversed from strong support level 21000.00

– Likely to rise to resistance level 22000.00

Nasdaq 100 index recently reversed up from the strong support level 21000.00 (former resistance from the start of November), intersecting with the support trendline of the daily up channel from November and the 50% Fibonacci correction of the upward impulse from October.

The upward reversal from the support level 21000.00 created the daily Japanese candlesticks reversal pattern Long-legged Doji.

Given the clear daily uptrend, Nasdaq 100 index can be expected to rise to the next resistance level 22000.00, which stopped the previous impulse wave i.

The FxPro Tech Analysis Team

The FxPro technical experts prepare a daily analysis of the most active currency pairs (majors, crosses, exotics) and commodities. Selected instruments are reviewed on daily trends (D1, H4), using the active Elliott Wave setups, Japanese candlesticks, indicators, and support/resistance levels.

Share
Published by
The FxPro Tech Analysis Team
Tags: Nasdaq 100

Recent Posts

CHFJPY Wave Analysis – 9 January 2026

CHFJPY: ⬆️ Buy - CHFJPY reversed from support area - Likely to rise to resistance…

6 hours ago

Exxon Mobil Wave Analysis – 9 January 2026

Exxon Mobil: ⬆️ Buy - Exxon Mobil reversed from support area - Likely to rise…

6 hours ago

Pro News Weekly: Dollar Rebounds as Markets Test New Limits

Welcome to Pro News Weekly! Here’s what is shaping the markets: 💵 The U.S. dollar…

10 hours ago

Geopolitics will destroy the euro

•    EURUSD falls due to geopolitics and expectations of tariff removal •    Gold returns to…

18 hours ago

Platinum Wave Analysis – 8 January 2026

Platinum: ⬇️ Sell - Platinum reversed from pivotal resistance level 150.00 - Likely to fall to…

1 day ago

Baidu Wave Analysis – 8 January 2026

Baidu: ⬇️ Sell - Baidu reversed from resistance zone - Likely to fall to support level…

1 day ago

This website uses cookies