Categories: Technical analysis

NASDAQ-100 Wave Analysis 20 January, 2021

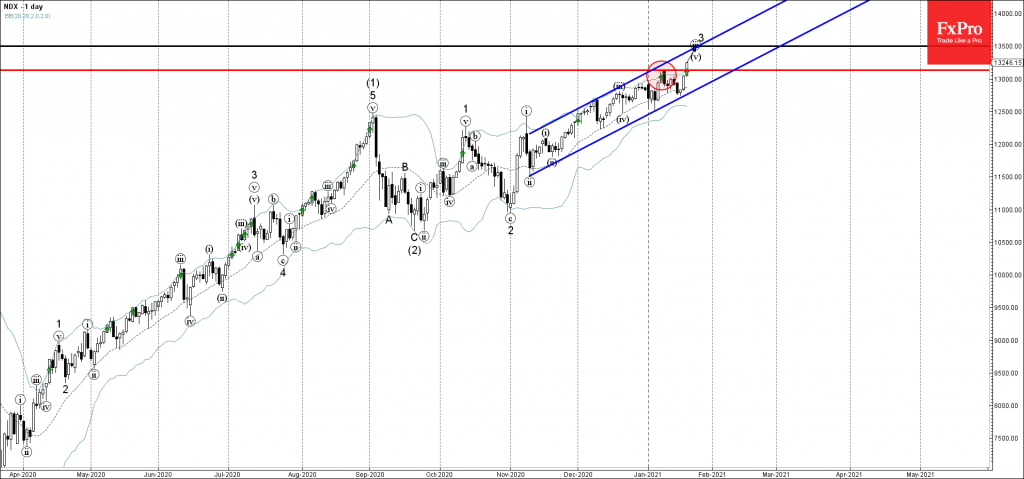
• NASDAQ-100 broke resistance level 13130.00

• Likely to rise to 13500.00

NASDAQ-100 recently broke above the resistance level 13130.00 (which formed the daily reversal pattern Bearish Engulfing at the start of January).

The breakout of the resistance level 13130.00 should accelerate the active impulse waves (v) and 3.

NASDAQ-100 is expected to rise further toward the next resistance level 13500.00 (target price for the completion of the active (v) and 3 – intersecting with the up channel from November).

The FxPro Tech Analysis Team

The FxPro technical experts prepare a daily analysis of the most active currency pairs (majors, crosses, exotics) and commodities. Selected instruments are reviewed on daily trends (D1, H4), using the active Elliott Wave setups, Japanese candlesticks, indicators, and support/resistance levels.

Share
Published by
The FxPro Tech Analysis Team
Tags: NDX

Recent Posts

US Indices: growth widens, but are expectations too high?

Tech sell-off and high Q4 forecasts put the S&P 500 at risk; the Russell 2000…

4 hours ago

Markets pick up signals from the White House

Donald Trump has no intention of dismissing Jerome Powell. The White House's decision to postpone…

7 hours ago

Nat Gas Current situation #tradelikeapro #tradingshort #tradingtips #gas #tradingstrategy #trading

Today is Thursday, January 15th. Once again we will talk about the gas market. The…

7 hours ago

Bitcoin aims to break out of a corrective rebound

Crypto market rebounds, Bitcoin eyes $100K, Dash surges, institutional demand rises, and Ethereum staking hits…

7 hours ago

Bitcoin Wave Analysis – 14 January 2026

Bitcoin: ⬆️ Buy - Bitcoin broke resistance area - Likely to rise to resistance level…

22 hours ago

NZDJPY Wave Analysis – 14 January 2026

NZDJPY: ⬇️ Sell - NZDJPY reversed down from the resistance area - Likely to fall…

22 hours ago

This website uses cookies