• Nasdaq-100 broke resistance area
• Likely to rise to resistance level 15750.00
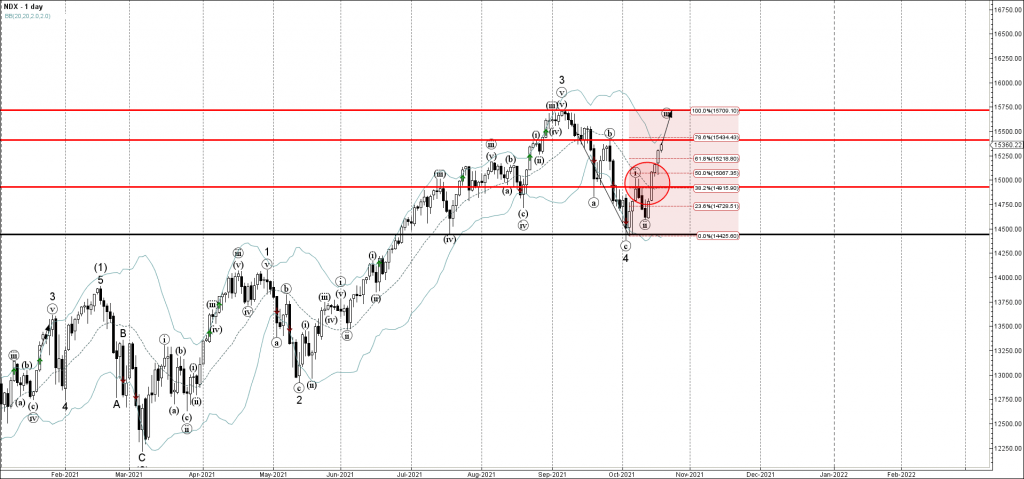
Nasdaq-100 index recently broke the resistance area lying between the round resistance level 15000.00 (which stopped the previous impulse wave (i) at the start of October) and the 50% Fibonacci correction of the ABC correction 4 impulse from the start of September.
The breakout of this resistance area accelerated the active impulse wave (iii), which belongs to the higher-level impulse waves 3 and (3).
Nasdaq-100 index can be expected to rise further toward the next resistance level 15750.00 (target price for the completion of the active impulse wave (iii)).