Categories: Technical analysis

Nasdaq-100 Wave Analysis – 19 June 2025

Nasdaq-100: ⬇️ Sell

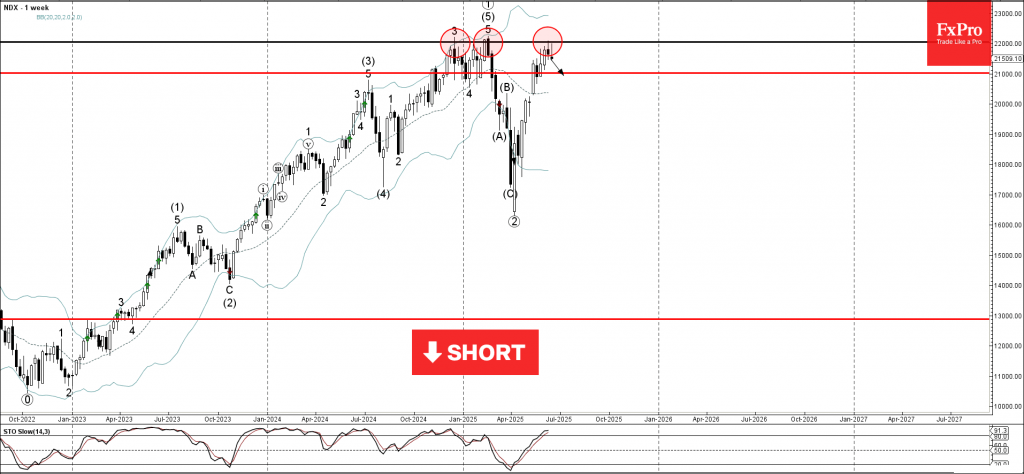
– Nasdaq-100 reversed from long-term resistance level 22000.00

– Likely to fall to support level 21000.00

Nasdaq-100 index recently reversed down from the major long-term resistance level 22000.00 (which has been steadily reversing the price from the end of last year).

The downward reversal from the resistance level 22000.00 will form the weekly Shooting Star candlesticks reversal pattern if the price closes this week near the current levels.

Given the strength of the resistance level 22000.00 and the overbought weekly Stochastic, Nasdaq-100 index can be expected to fall to the next support level at 21000.00.

The FxPro Tech Analysis Team

The FxPro technical experts prepare a daily analysis of the most active currency pairs (majors, crosses, exotics) and commodities. Selected instruments are reviewed on daily trends (D1, H4), using the active Elliott Wave setups, Japanese candlesticks, indicators, and support/resistance levels.

Share
Published by
The FxPro Tech Analysis Team
Tags: Nasdaq 100

Recent Posts

Solana Wave Analysis – 5 December 2025

Solana: ⬇️ Sell - Solana reversed from resistance zone - Likely to fall to support…

1 hour ago

EURAUD Wave Analysis – 5 December 2025

EURAUD : ⬇️ Sell - EURAUD broke the support level 1.7600 - Likely to fall…

1 hour ago

Forex has set its priorities

In 2026, experts favour the yen, see modest euro growth, and expect pressure on the…

5 hours ago

Bear market rebound in crypto is likely to continue

Crypto rebounds continue; Bitcoin faces resistance, with a mixed market outlook ahead, as regulatory changes…

6 hours ago

Coca-Cola Wave Analysis – 4 December 2025

Coca-Cola: ⬇️ Sell - Coca-Cola reversed from long-term resistance level 73.25 - Likely to fall to…

20 hours ago

DraftKings Wave Analysis – 4 December 2025

DraftKings: ⬆️ Buy - DraftKings reversed from support zone - Likely to rise to resistance level…

20 hours ago

This website uses cookies