Categories: Technical analysis

Nasdaq-100 Wave Analysis – 15 September 2025

Nasdaq-100: ⬆️ Buy

– Nasdaq-100 broke key resistance level 24000.00

– Likely to rise to resistance level 25000.00

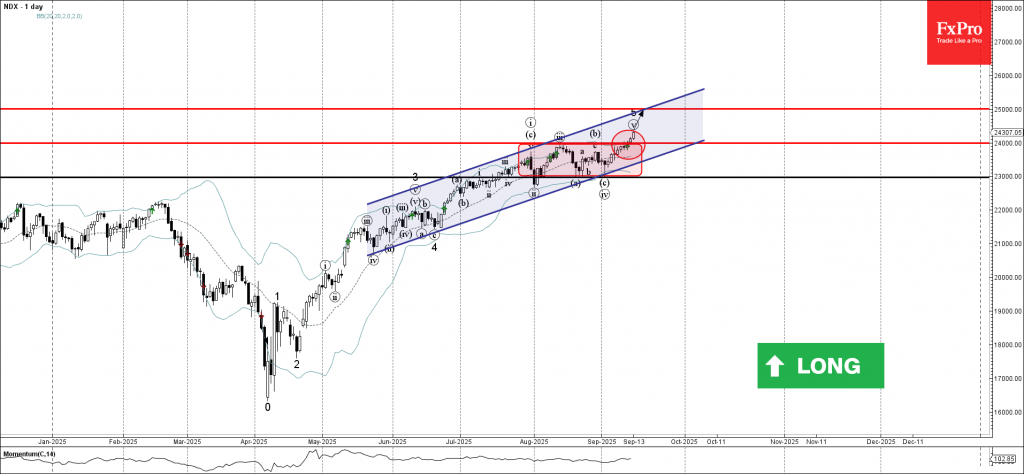
Nasdaq-100 index recently broke above the key resistance level 24000.00 (upper border of the narrow sideways price range inside which the index has been trading from July).

The breakout of the resistance level 24000.00 accelerated the active impulse wave v of the higher order impulse wave 5 from June.

Given the clear daily uptrend, Nasdaq-100 index can be expected to rise to the next resistance level 25000.00, target for the completion of the active impulse wave v.

The FxPro Tech Analysis Team

The FxPro technical experts prepare a daily analysis of the most active currency pairs (majors, crosses, exotics) and commodities. Selected instruments are reviewed on daily trends (D1, H4), using the active Elliott Wave setups, Japanese candlesticks, indicators, and support/resistance levels.

Share
Published by
The FxPro Tech Analysis Team
Tags: Nasdaq-100

Recent Posts

Geopolitics will destroy the euro

•    EURUSD falls due to geopolitics and expectations of tariff removal •    Gold returns to…

6 hours ago

Platinum Wave Analysis – 8 January 2026

Platinum: ⬇️ Sell - Platinum reversed from pivotal resistance level 150.00 - Likely to fall to…

20 hours ago

Baidu Wave Analysis – 8 January 2026

Baidu: ⬇️ Sell - Baidu reversed from resistance zone - Likely to fall to support level…

20 hours ago

EURUSD Wave Analysis – 8 January 2026

EURUSD: ⬇️ Sell - EURUSD broke daily up channel - Likely to fall to support…

21 hours ago

WTI crude oil Wave Analysis – 8 January 2026

WTI crude oil: ⬆️ Buy - WTI crude oil reversed from support zone - Likely…

21 hours ago

Do not underestimate dollar

Positive macro statistics for the US are helping the greenback. Gold could rise to $4,610…

1 day ago

This website uses cookies