Categories: Technical analysis

Nasdaq-100 Wave Analysis – 13 May 2025

Nasdaq-100: ⬆️ Buy

– Nasdaq-100 broke resistance area

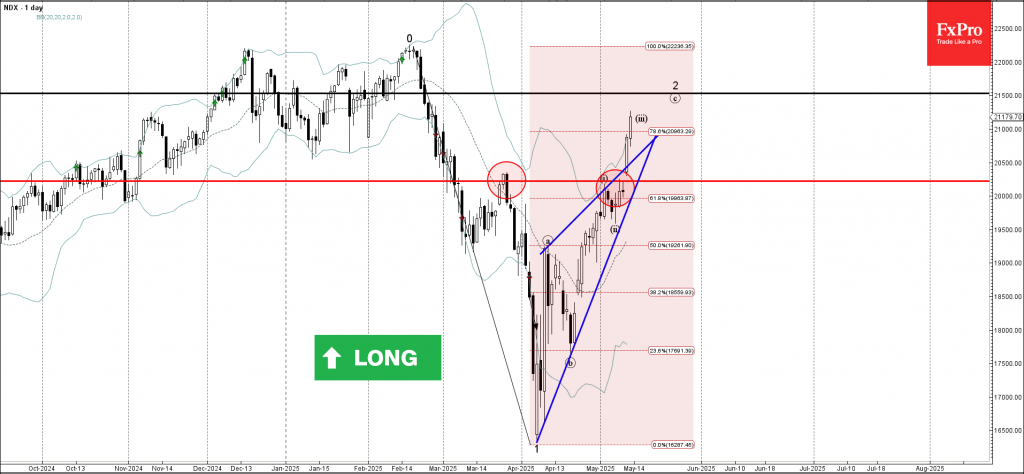
– Likely to rise to resistance level 21500.00

Nasdaq-100 index recently broke the resistance area between the resistance level 20220.00 (which has been reversing the index from March) and the resistance trendline of the Ascending Triangle from April.

The breakout of this resistance area accelerated the active short-term ABC correction 2 from last month.

Nasdaq-100 index can be expected to rise to the next resistance level 21500.00 (target price for the completion of the active wave 2).

The FxPro Tech Analysis Team

The FxPro technical experts prepare a daily analysis of the most active currency pairs (majors, crosses, exotics) and commodities. Selected instruments are reviewed on daily trends (D1, H4), using the active Elliott Wave setups, Japanese candlesticks, indicators, and support/resistance levels.

Share
Published by
The FxPro Tech Analysis Team
Tags: Nasdaq 100

Recent Posts

Geopolitics will destroy the euro

•    EURUSD falls due to geopolitics and expectations of tariff removal •    Gold returns to…

1 hour ago

Platinum Wave Analysis – 8 January 2026

Platinum: ⬇️ Sell - Platinum reversed from pivotal resistance level 150.00 - Likely to fall to…

14 hours ago

Baidu Wave Analysis – 8 January 2026

Baidu: ⬇️ Sell - Baidu reversed from resistance zone - Likely to fall to support level…

15 hours ago

EURUSD Wave Analysis – 8 January 2026

EURUSD: ⬇️ Sell - EURUSD broke daily up channel - Likely to fall to support…

16 hours ago

WTI crude oil Wave Analysis – 8 January 2026

WTI crude oil: ⬆️ Buy - WTI crude oil reversed from support zone - Likely…

16 hours ago

Do not underestimate dollar

Positive macro statistics for the US are helping the greenback. Gold could rise to $4,610…

23 hours ago

This website uses cookies