Categories: Technical analysis

Nasdaq-100 Wave Analysis – 10 November 2025

Nasdaq-100: ⬆️ Buy

– Nasdaq-100 reversed from support level 25000.00

– Likely to rise to resistance level 26250.00

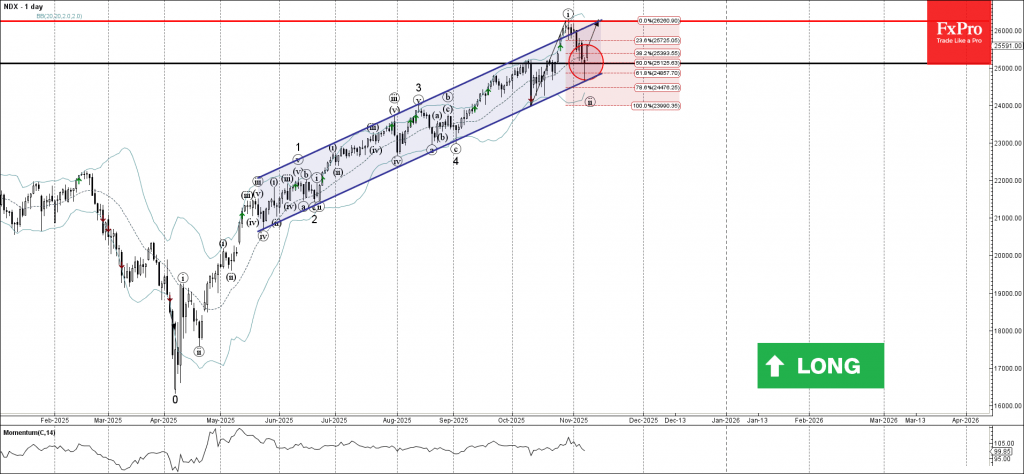
Nasdaq-100 index recently reversed up with the daily Hammer from the support zone between the round support level 25000.00 and the support trendline of the daily up channel from May.

This support zone was strengthened by the 61.8% Fibonacci correction of the sharp upward impulse from October.

Given the clear daily trend, Nasdaq-100 index can be expected to rise to the next resistance level 26250.00 (top of the previous impulse wave i).

The FxPro Tech Analysis Team

The FxPro technical experts prepare a daily analysis of the most active currency pairs (majors, crosses, exotics) and commodities. Selected instruments are reviewed on daily trends (D1, H4), using the active Elliott Wave setups, Japanese candlesticks, indicators, and support/resistance levels.

Share
Published by
The FxPro Tech Analysis Team
Tags: nasdaq

Recent Posts

AUDUSD Wave Analysis – 24 December 2025

AUDUSD: ⬆️ Buy - AUDUSD broke key resistance level 0.6690 - Likely to rise to…

2 days ago

Tron Wave Analysis – 24 December 2025

Tron: ⬇️ Sell - Tron reversed from resistance zone - Likely to fall to support…

2 days ago

Stellar Wave Analysis – 24 December 2025

Stellar: ⬇️ Sell - Stellar reversed from pivotal resistance level 0.2200 - Likely to fall…

2 days ago

USDCHF Wave Analysis – 24 December 2025

USDCHF: ⬇️ Sell - USDCHF broke support level 0.7885 - Likely to fall to support…

2 days ago

Precious metals rewarded for success

The US dollar is falling as a safe-haven asset amid growing risk appetite. Gold is…

2 days ago

Crypto market: the punchline is coming soon

Market Overview The crypto market cap declined 1.7% over the past day and 15% or…

2 days ago

This website uses cookies