Categories: Technical analysis

Nasdaq-100 index Wave Analysis 8 January 2024

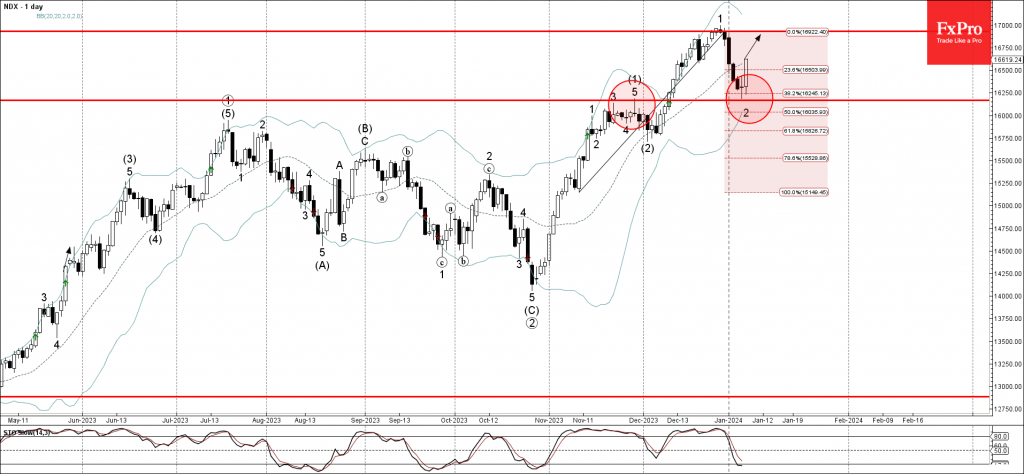
– Nasdaq-100 index reversed from support level 16170.00

– Likely to rise to resistance level 16930.00

Nasdaq-100 index recently reversed up from the pivotal support level 16170.00 (former double top from the end of November) intersecting with the 38.2% Fibonacci correction of the upward impulse from November.

The upward reversal from the support level 16170.00 stopped the previous short-term correction 2.

Given the predominant daily uptrend, Nasdaq-100 index can be expected to rise further to the next resistance level 16930.00 (previous monthly top from December).

The FxPro Tech Analysis Team

The FxPro technical experts prepare a daily analysis of the most active currency pairs (majors, crosses, exotics) and commodities. Selected instruments are reviewed on daily trends (D1, H4), using the active Elliott Wave setups, Japanese candlesticks, indicators, and support/resistance levels.

Share
Published by
The FxPro Tech Analysis Team
Tags: Nasdaq-100

Recent Posts

EURCAD Wave Analysis 6 September 2024

- EURCAD reversed from pivotal support level 1.4900 - Likely to rise to resistance level…

1 day ago

EURUSD Wave Analysis 6 September 2024

- EURUSD reversed from support level 1.1030 - Likely to rise to resistance level 1.1200…

1 day ago

Further Unwinding of Carry Trade

The unwinding of the carry trade in the FX market continues, with the major safe…

1 day ago

Bitcoin pressured by risk-off mood

Market Picture The pressure on risk assets continues, pushing the crypto market capitalisation back below…

2 days ago

AUDUSD Wave Analysis 5 September 2024

- AUDUSD reversed from support level 0.6700 - Likely to rise to resistance level 0.6800…

2 days ago

Gold Wave Analysis 5 September 2024

- Gold reversed from support level 2475.00 - Likely to rise to resistance level 2535.00…

2 days ago

This website uses cookies