Categories: Technical analysis

Nasdaq-100 index Wave Analysis 26 March 2024

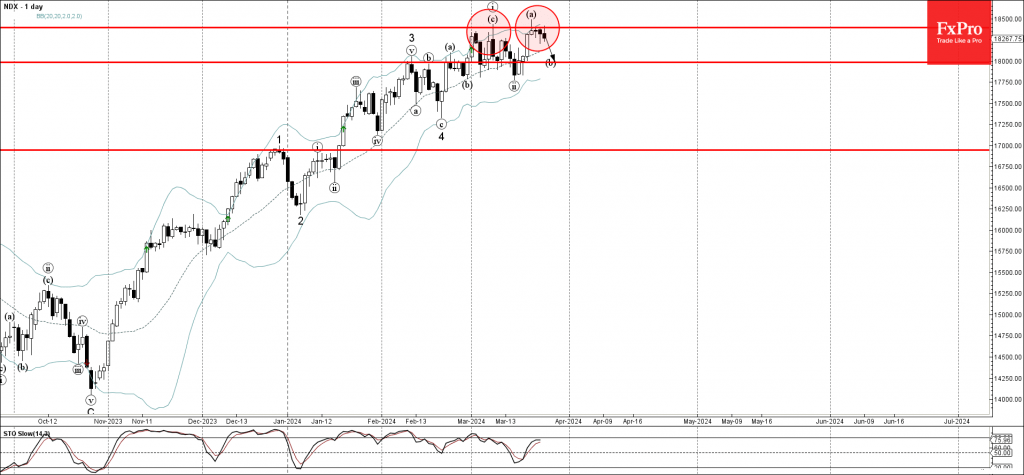
– Nasdaq-100 index reversed from resistance level 18400.00

– Likely to fall to support level 18000.00

Nasdaq-100 index recently reversed down from the key resistance level 18400.00 (strengthened by the upper daily Bollinger Band), which has been reversing the index from the start of March.

The downward reversal from the resistance level 18400.00 started the active minor correction (b).

Given the strength of the resistance level 18400.00 and the bearish divergence on the daily Stochastic, Nasdaq-100 index can be expected to fall further to the next round support level 18000.00.

The FxPro Tech Analysis Team

The FxPro technical experts prepare a daily analysis of the most active currency pairs (majors, crosses, exotics) and commodities. Selected instruments are reviewed on daily trends (D1, H4), using the active Elliott Wave setups, Japanese candlesticks, indicators, and support/resistance levels.

Share
Published by
The FxPro Tech Analysis Team
Tags: nasdaq

Recent Posts

ECB, BoE, and BoJ take different paths

Trump pushes for more Fed rate cuts, while no changes are expected from the ECB…

3 hours ago

Crypto Market Holds at $3T Amid Broken Uptrend

Crypto market stays near $3T amid correction, ETF inflows rise, sentiment weakens, and volatility expected…

4 hours ago

Gold Wave Analysis – 12 December 2025

Gold: ⬇️ Sell - Gold reversed from strong resistance level 4350.00 - Likely to fall to…

3 days ago

EURGBP Wave Analysis – 12 December 2025

EURGBP: ⬆️ Buy - EURGBP reversed from support zone - Likely to rise to resistance level…

3 days ago

Filecoin Wave Analysis – 12 December 2025

Filecoin: ⬇️ Sell - Filecoin broke key support level 1.435 - Likely to fall to support…

3 days ago

Ethereum Wave Analysis – 12 December 2025

Ethereum: ⬇️ Sell - Ethereum reversed from resistance level 3400.00 - Likely to fall to support…

3 days ago

This website uses cookies