Categories: Technical analysis

Nasdaq 100 index Wave Analysis – 25 May 2023

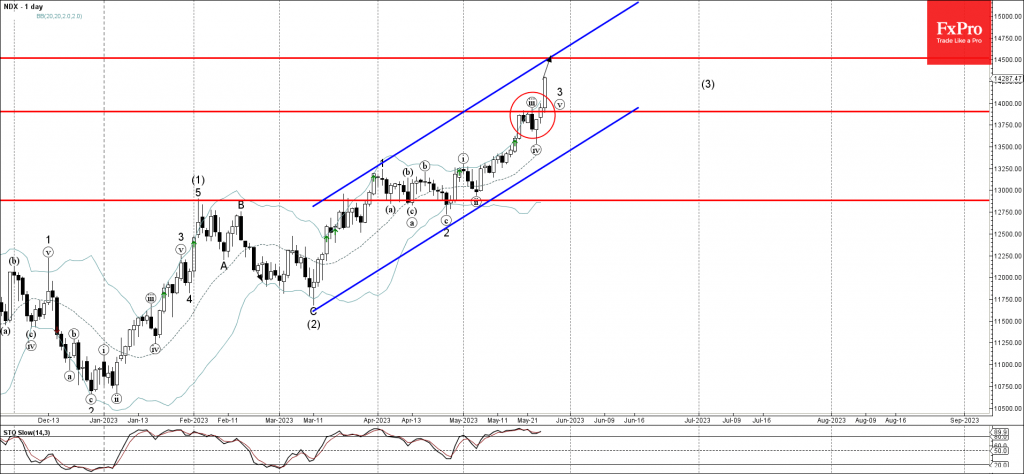
• Nasdaq 100 index broke key resistance level 13900.00

• Likely to rise to resistance level 14500,00

Nasdaq 100 index under the bullish pressure after the earlier breakout of the key resistance level 13900.00 (top of wave (iii) from the middle of month).

The breakout of the resistance level 13900.00 accelerated the active minor impulse wave , which belongs to the intermediate impulse wave (3) from March.

Nasdaq 100 can be expected to rise toward the next resistance level 14500,00 (coinciding with the resistance trendline of the daily up channel from March).

The FxPro Tech Analysis Team

The FxPro technical experts prepare a daily analysis of the most active currency pairs (majors, crosses, exotics) and commodities. Selected instruments are reviewed on daily trends (D1, H4), using the active Elliott Wave setups, Japanese candlesticks, indicators, and support/resistance levels.

Share
Published by
The FxPro Tech Analysis Team
Tags: Nasdaq 100

Recent Posts

Video: Dollar and Indices are trying to find footing after the fall

The dollar experienced a sell-off but rallied back up by the end of the week.…

2 days ago

What is next: BoJ, Fed, SNB & BoE Rates

The new week will be packed with economic data and decisions from key central banks.…

2 days ago

Dollar attempts to rebound after oversold conditions

Despite economic factors working against the dollar, its oversold condition helped it this week or…

2 days ago

USDCAD Wave Analysis – 14 March 2025

USDCAD: ⬇️ Sell - USDCAD reversed from key resistance level 1.4500 - Likely to fall…

2 days ago

Solana Wave Analysis – 14 March 2025

Solana: ⬆️ Buy - Solana reversed from the long-term support level 113.75 - Likely to…

2 days ago

Adobe Wave Analysis – 13 March 2025

Adobe: ⬇️ Sell - Adobe broke round support level 400.00 - Likely to fall to…

3 days ago

This website uses cookies