Categories: Technical analysis

Nasdaq-100 index Wave Analysis 12 March 2024

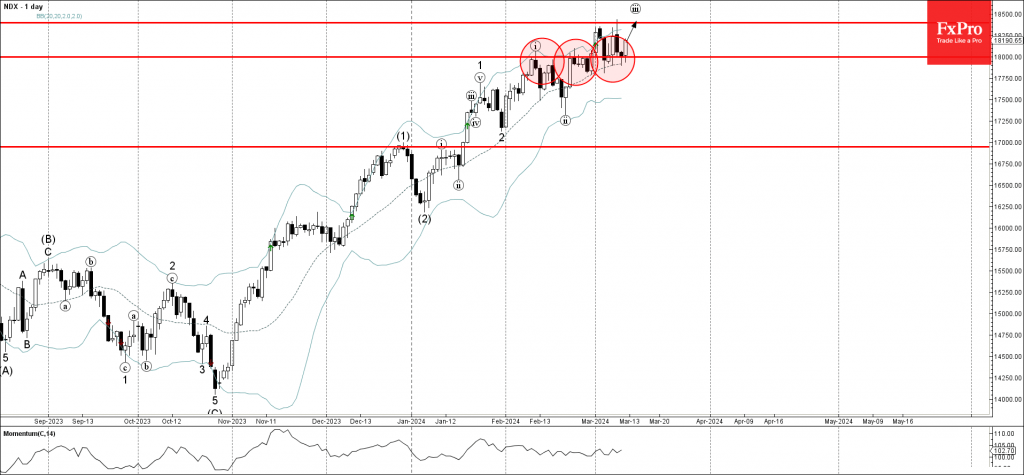
– Nasdaq-100 index reversed from key support level 18000.00

– Likely to rise to resistance level 18400.00

Nasdaq-100 index recently reversed up from the key support level 18000.00 (former strong resistance from February acting as the support after it was broken earlier) coinciding with the 20-day moving average.

The upward reversal from the support level 18000.00 continues the three of the active impulse waves iii, 3 and (3).

Given the predominant daily uptrend, Nasdaq-100 index can be expected to rise further toward the next resistance level 18400.00 (which reversed the index earlier this month).

The FxPro Tech Analysis Team

The FxPro technical experts prepare a daily analysis of the most active currency pairs (majors, crosses, exotics) and commodities. Selected instruments are reviewed on daily trends (D1, H4), using the active Elliott Wave setups, Japanese candlesticks, indicators, and support/resistance levels.

Share
Published by
The FxPro Tech Analysis Team
Tags: nasdaq

Recent Posts

EURCAD Wave Analysis 6 September 2024

- EURCAD reversed from pivotal support level 1.4900 - Likely to rise to resistance level…

2 days ago

EURUSD Wave Analysis 6 September 2024

- EURUSD reversed from support level 1.1030 - Likely to rise to resistance level 1.1200…

2 days ago

Further Unwinding of Carry Trade

The unwinding of the carry trade in the FX market continues, with the major safe…

2 days ago

Bitcoin pressured by risk-off mood

Market Picture The pressure on risk assets continues, pushing the crypto market capitalisation back below…

2 days ago

AUDUSD Wave Analysis 5 September 2024

- AUDUSD reversed from support level 0.6700 - Likely to rise to resistance level 0.6800…

2 days ago

Gold Wave Analysis 5 September 2024

- Gold reversed from support level 2475.00 - Likely to rise to resistance level 2535.00…

2 days ago

This website uses cookies