Categories: Technical analysis

Motorola Wave Analysis 15 January, 2021

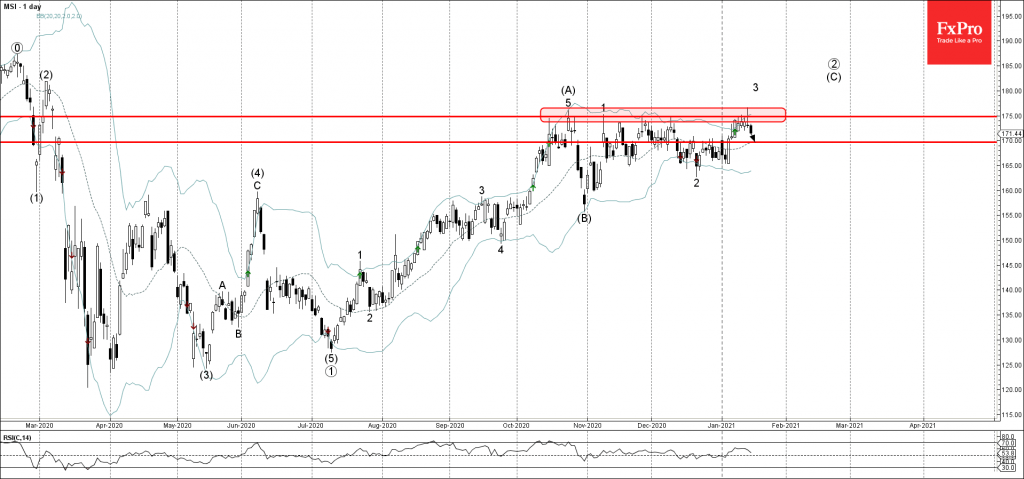
• Motorola reversed from powerful resistance level 175.00

• Likely to fall to 170.00

Motorola recently reversed down with the daily Shooting Star from the powerful resistance level 175.00 (which has been reversing the price from the middle of October) – strengthened by the upper daily Bollinger Band.

The downward reversal from the resistance level 175.00 runs counter to the previous impulse waves 3 and (C).

Given the strength of the resistance level 175.00 – Motorola is expected to fall further toward the next support level 170.00.

The FxPro Tech Analysis Team

The FxPro technical experts prepare a daily analysis of the most active currency pairs (majors, crosses, exotics) and commodities. Selected instruments are reviewed on daily trends (D1, H4), using the active Elliott Wave setups, Japanese candlesticks, indicators, and support/resistance levels.

Share
Published by
The FxPro Tech Analysis Team

Recent Posts

The dollar does not tolerate dissent

US GDP growth is driven not by the White House, but by AI. The Bank…

10 hours ago

The crypto market has made a breakthrough

The crypto market surges, hitting new highs, with bullish sentiment for Bitcoin and Ethereum amid…

10 hours ago

Brent Crude oil Wave Analysis – 13 January 2026

Brent Crude oil ⬆️ Buy - Brent Crude oil rising inside impulse wave c -…

1 day ago

USDJPY Wave Analysis – 13 January 2026

USDJPY ⬆️ Buy - USDJPY broke resistance area - Likely to rise to resistance level…

1 day ago

Exxon Mobil Wave Analysis – 13 January 2026

Exxon Mobil ⬆️ Buy - Exxon Mobil broke resistance level 125.60 - Likely to rise…

1 day ago

BNB Wave Analysis – 13 January 2026

Brent Crude oil ⬆️ Buy - BNB broke out of sideways price range - Likely…

1 day ago

This website uses cookies