Categories: Technical analysis

Morgan Stanley Wave Analysis 26 November, 2020

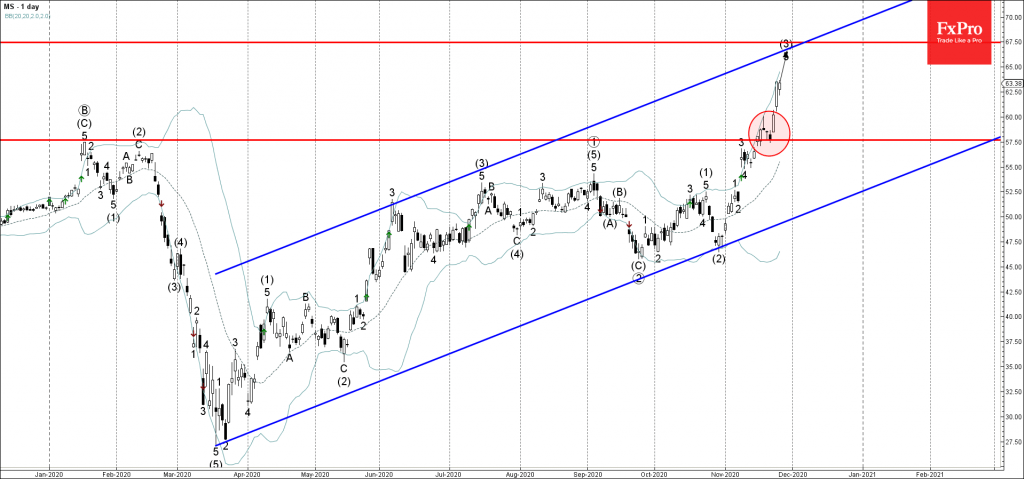
• Morgan Stanley reversed from support level 57,50

• Likely to rise to 67,5

Morgan Stanley earlier reversed up from the key support level 57,50 (former multi-month high from January) – which signalled the continuation of the active impulse waves 5 and (3).

The active impulse waves 5 and (3) belong to the primary upward impulse sequence ③ from the end of September.

Morgan Stanley is likely to rise further toward the next resistance level 67,5 (target price for the completion of the active impulse (3) intersecting with the resistance trendline of the weekly up channel from March).

The FxPro Tech Analysis Team

The FxPro technical experts prepare a daily analysis of the most active currency pairs (majors, crosses, exotics) and commodities. Selected instruments are reviewed on daily trends (D1, H4), using the active Elliott Wave setups, Japanese candlesticks, indicators, and support/resistance levels.

Share
Published by
The FxPro Tech Analysis Team
Tags: MS

Recent Posts

Bitcoin Cash Wave Analysis – 12 January 2026

Bitcoin Cash: ⬇️ Sell - Bitcoin Cash reversed from resistance area - Likely to fall…

11 hours ago

EURJPY Wave Analysis – 12 January 2026

EURJPY: ⬆️ Buy - EURJPY reversed from support area - Likely to rise to resistance…

11 hours ago

Gold shines on an anti-fiat thesis

The dollar suffered due to threats to the Fed’s independence. Gold managed to renew its…

20 hours ago

SP500 Current situation #trading #tradelikeapro #sp500 #tradingshorts #tradingstrategy

Today is Monday, the 12th of January, and once again we will talk about the…

21 hours ago

Crypto: sell-the-growth continues

Crypto markets remain volatile; Bitcoin faces selling pressure, XRP slips, Monero surges, and market signals…

22 hours ago

CHFJPY Wave Analysis – 9 January 2026

CHFJPY: ⬆️ Buy - CHFJPY reversed from support area - Likely to rise to resistance…

4 days ago

This website uses cookies