Categories: Technical analysis

Microsoft Wave Analysis – 28 November, 2019

  • Microsoft broke resistance level 151.00
  • Likely to rise to 156.60

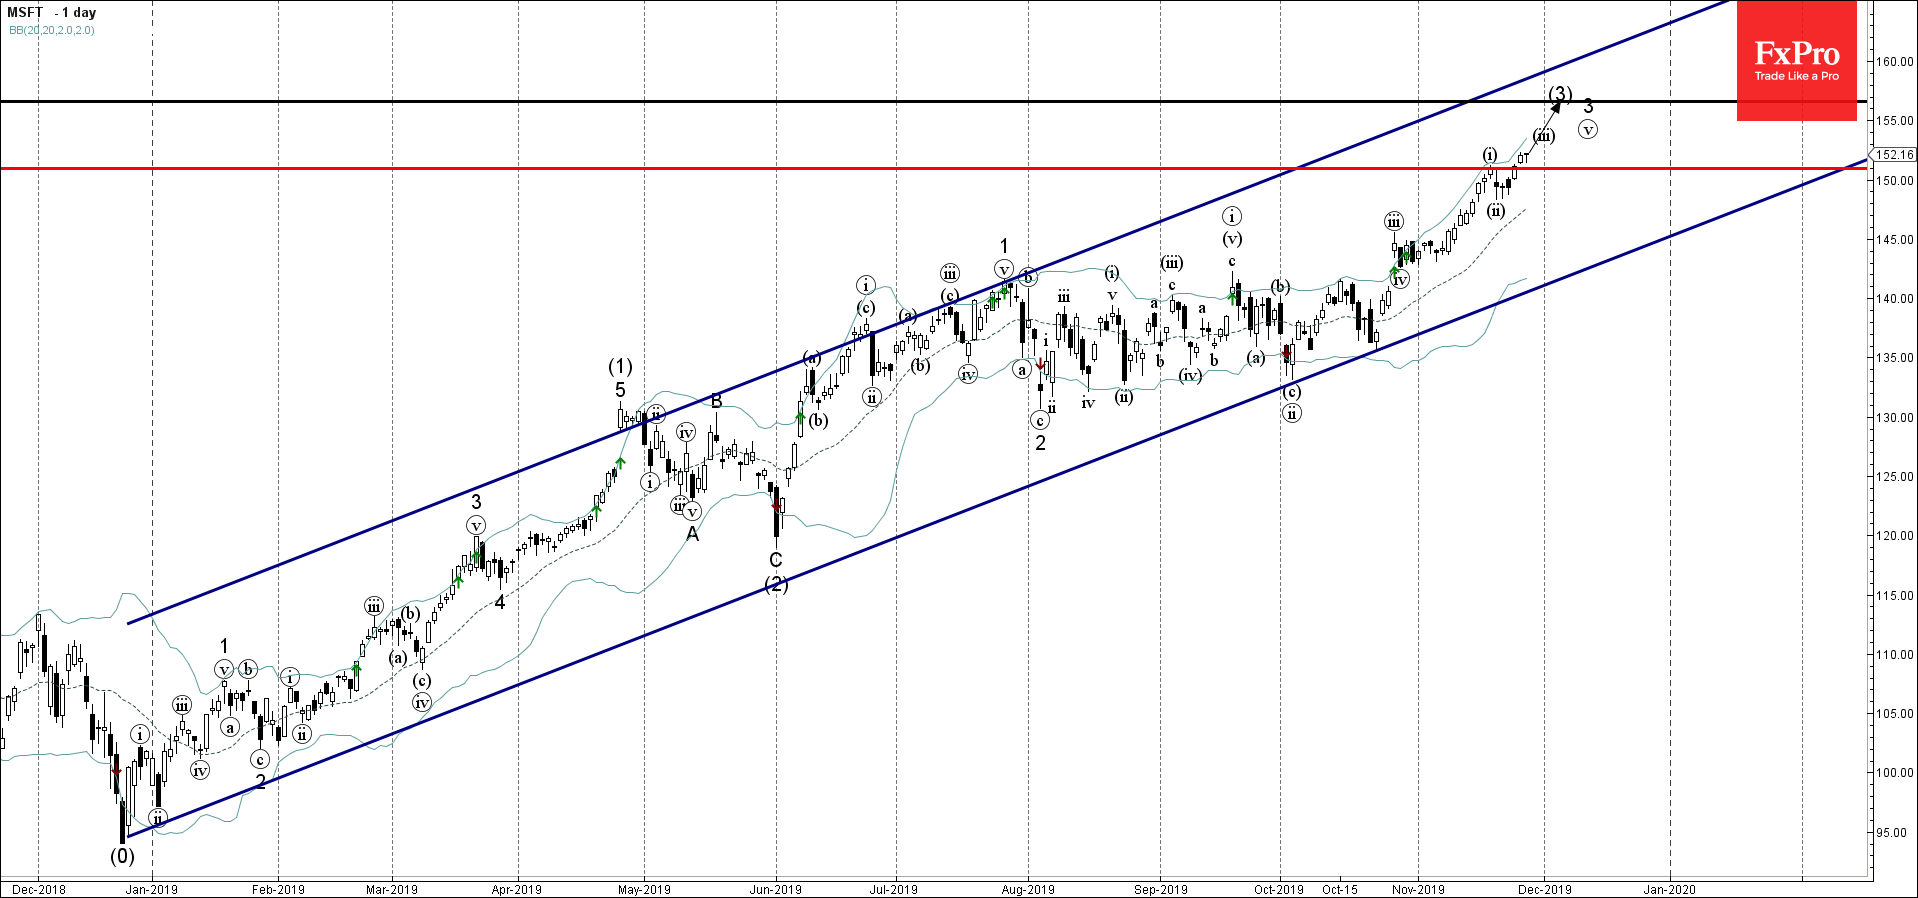
Microsoft recently broke above the key resistance level 151.00 (which stopped the previous impulse wave (i)).

The breakout of the resistance level 151.00 accelerated the active impulse wave 3, which belongs to the medium-term impulse sequence (3) from June.

Microsoft is expected to rise further toward the next resistance level 156.60 (target price for the completion of the active wave (3)).

AddThis Website Tools
The FxPro Tech Analysis Team

The FxPro technical experts prepare a daily analysis of the most active currency pairs (majors, crosses, exotics) and commodities. Selected instruments are reviewed on daily trends (D1, H4), using the active Elliott Wave setups, Japanese candlesticks, indicators, and support/resistance levels.

Share
Published by
The FxPro Tech Analysis Team
Tags: MSFT

Recent Posts

USDJPY Wave Analysis – 24 March 2025

USDJPY: ⬆️ Buy - USDJPY broke the resistance zone - Likely to rise to the…

4 hours ago

Dow Jones Wave Analysis – 24 March 2025

Dow Jones: ⬆️ Buy - Dow Jones reversed from support zone - Likely to rise…

4 hours ago

Bitcoin pushes up from 200-day MA

Bitcoin pushed back from its 200-day low, with the crypto market capitalization rising to $2.86…

8 hours ago

Video: Market Shake-Up! Dollar, Bitcoin & Gold on the Move – What’s Next?

Big moves are brewing in the markets! 📉📈 The US Dollar is forming a bottom,…

13 hours ago

Tesla Wave Analysis – 21 March 2025

Tesla: ⬆️ Buy - Tesla reversed from support level 220.00 - Likely to rise to…

3 days ago

Google Wave Analysis – 21 March 2025

Google: ⬆️ Buy - Google reversed from key support level 160.00 - Likely to rise…

3 days ago