Categories: Technical analysis

MGM Wave Analysis – 17 September, 2020

• MGM reversed from resistance zone

• Likely to fall to 20.55

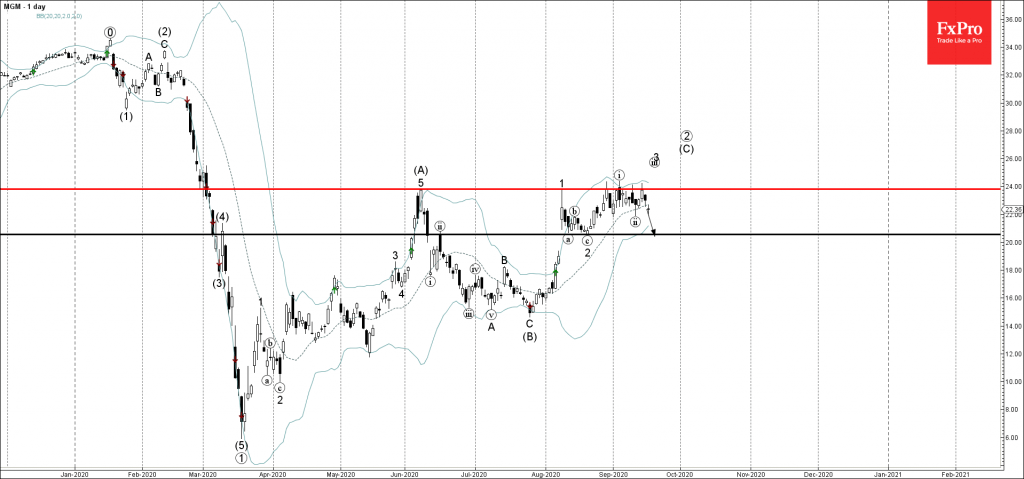
MGM recently reversed down from the resistance zone located between the key resistance level 24.00 (which has been steadily reversing the price from the start of June) and the upper daily Bollinger Band.

The downward reversal from this resistance zone stopped the previous multi-impulse sequence made up of the impulse waves 3 and (C).

MGM is likely to fall further toward the next support level 20.55 (low of the previous short-term correction 2 from last month).

AddThis Website Tools
The FxPro Tech Analysis Team

The FxPro technical experts prepare a daily analysis of the most active currency pairs (majors, crosses, exotics) and commodities. Selected instruments are reviewed on daily trends (D1, H4), using the active Elliott Wave setups, Japanese candlesticks, indicators, and support/resistance levels.

Share
Published by
The FxPro Tech Analysis Team

Recent Posts

AMD Wave Analysis – 28 March 2025

AMD: ⬇️ Sell - AMD reversed from pivotal resistance level 115.00 - Likely to fall…

11 hours ago

Google Wave Analysis – 28 March 2025

Google: ⬇️ Sell - Google broke key support level 160.00 - Likely to fall to…

11 hours ago

Gold Wave Analysis – 28 March 2025

Gold: ⬆️ Buy - Gold broke resistance level 3050.00 - Likely to rise to resistance…

11 hours ago

Ethereum Wave Analysis – 28 March 2025

Ethereum: ⬇️ Sell - Ethereum reversed from the resistance level 2120.00 - Likely to fall…

11 hours ago

US inflation accelerates but lags income growth

US PCE inflation exceeded expectations at 2.8% in February. Income growth and savings rates remain…

17 hours ago

What is next: Australia Rate, EU CPI, US NFP

Europe will switch to daylight saving time next week. Key events include the RBA's rate…

19 hours ago