Categories: Technical analysis

LLOY Wave Analysis – 17 September 2025

LLOY: ⬇️ Sell

– LLOY reversed from resistance zone

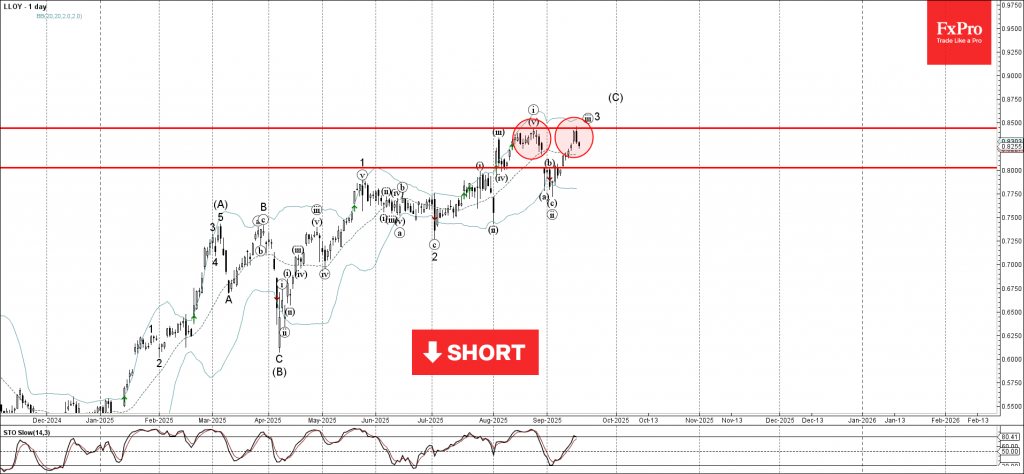
– Likely to fall to support level 0.8000

LLOY recently reversed down from the resistance zone between the resistance level 0.8445 (former monthly high from August) and the upper daily Bollinger Band.

The downward reversal from the resistance level 0.8445 created the daily Japanese candlesticks reversal pattern Bearish Engulfing.

Given the strength of the resistance level 0.8445 and the overbought daily Stochastic, LLOY can be expected to fall to the next round support level 0.8000.

The FxPro Tech Analysis Team

The FxPro technical experts prepare a daily analysis of the most active currency pairs (majors, crosses, exotics) and commodities. Selected instruments are reviewed on daily trends (D1, H4), using the active Elliott Wave setups, Japanese candlesticks, indicators, and support/resistance levels.

Share
Published by
The FxPro Tech Analysis Team
Tags: LLOY

Recent Posts

AUDUSD Wave Analysis – 24 December 2025

AUDUSD: ⬆️ Buy - AUDUSD broke key resistance level 0.6690 - Likely to rise to…

2 days ago

Tron Wave Analysis – 24 December 2025

Tron: ⬇️ Sell - Tron reversed from resistance zone - Likely to fall to support…

2 days ago

Stellar Wave Analysis – 24 December 2025

Stellar: ⬇️ Sell - Stellar reversed from pivotal resistance level 0.2200 - Likely to fall…

2 days ago

USDCHF Wave Analysis – 24 December 2025

USDCHF: ⬇️ Sell - USDCHF broke support level 0.7885 - Likely to fall to support…

2 days ago

Precious metals rewarded for success

The US dollar is falling as a safe-haven asset amid growing risk appetite. Gold is…

2 days ago

Crypto market: the punchline is coming soon

Market Overview The crypto market cap declined 1.7% over the past day and 15% or…

2 days ago

This website uses cookies