Categories: Technical analysis

Litecoin Wave Analysis –5 September 2025

Litecoin: ⬆️ Buy

– Litecoin reversed from support area

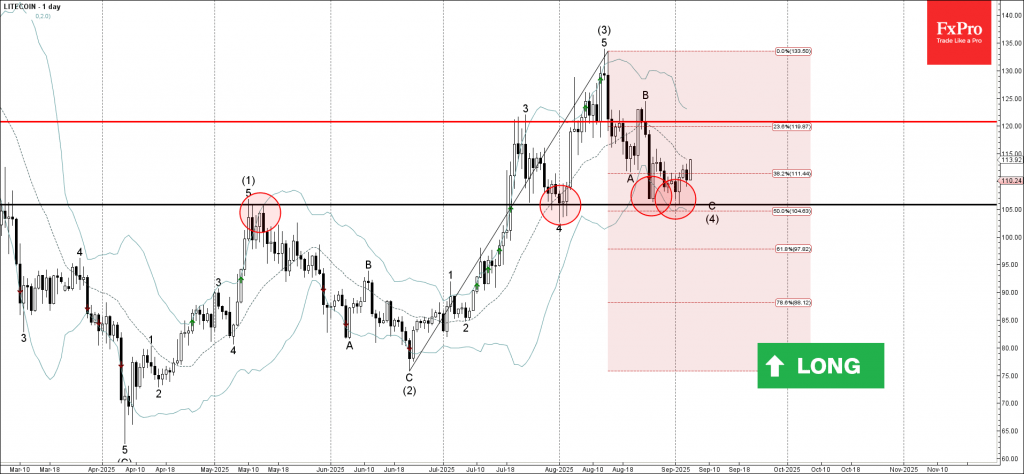
– Likely to rise to resistance level 120.00.

Litecoin cryptocurrency recently reversed from the support area between the key support level 105.00 (former monthly high from May, which has been reversing the price from July), lower daily Bollinger Band and the 50% Fibonacci correction of the upward impulse from August.

The upward reversal from this support area created the daily Japanese candlesticks reversal pattern Bullish Engulfing – which stopped earlier wave C.

Given the bullish sentiment across the cryptocurrency markets, Litecoin can be expected to rise to the next resistance level 120.00.

The FxPro Tech Analysis Team

The FxPro technical experts prepare a daily analysis of the most active currency pairs (majors, crosses, exotics) and commodities. Selected instruments are reviewed on daily trends (D1, H4), using the active Elliott Wave setups, Japanese candlesticks, indicators, and support/resistance levels.

Share
Published by
The FxPro Tech Analysis Team
Tags: Litecoin

Recent Posts

CHFJPY Wave Analysis – 9 January 2026

CHFJPY: ⬆️ Buy - CHFJPY reversed from support area - Likely to rise to resistance…

32 minutes ago

Exxon Mobil Wave Analysis – 9 January 2026

Exxon Mobil: ⬆️ Buy - Exxon Mobil reversed from support area - Likely to rise…

33 minutes ago

Pro News Weekly: Dollar Rebounds as Markets Test New Limits

Welcome to Pro News Weekly! Here’s what is shaping the markets: 💵 The U.S. dollar…

5 hours ago

Geopolitics will destroy the euro

•    EURUSD falls due to geopolitics and expectations of tariff removal •    Gold returns to…

12 hours ago

Platinum Wave Analysis – 8 January 2026

Platinum: ⬇️ Sell - Platinum reversed from pivotal resistance level 150.00 - Likely to fall to…

1 day ago

Baidu Wave Analysis – 8 January 2026

Baidu: ⬇️ Sell - Baidu reversed from resistance zone - Likely to fall to support level…

1 day ago

This website uses cookies