Categories: Technical analysis

Johnson & Johnson Wave Analysis – 30 September 2025

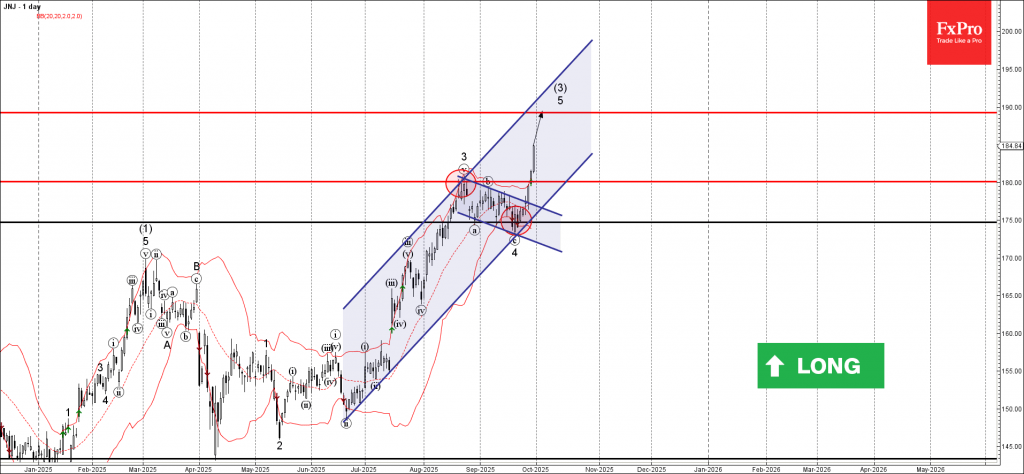
Johnson & Johnson: ⬆️ Buy

– Johnson & Johnson broke key resistance level 180.00

– Likely to rise to resistance level 190.00

Johnson & Johnson recently broke sharply above the key resistance level 180.00 (which stopped the previous minor impulse wave 3 at the end of August).

The breakout of the resistance level 180.00 accelerated the active impulse wave 5 of the intermediate impulse wave (3) from April.

Given the predominant daily uptrend, Johnson & Johnson can be expected to rise to the next resistance level 190.00, target price for the completion of the active impulse wave 5.

The FxPro Tech Analysis Team

The FxPro technical experts prepare a daily analysis of the most active currency pairs (majors, crosses, exotics) and commodities. Selected instruments are reviewed on daily trends (D1, H4), using the active Elliott Wave setups, Japanese candlesticks, indicators, and support/resistance levels.

Share
Published by
The FxPro Tech Analysis Team

Recent Posts

Pro News Weekly: Dollar Leads as Stocks Wobble

Welcome to Pro News Weekly! Here’s what is driving the markets this week: 💵 The…

23 hours ago

Strong macro data and rate spreads are the USD’s main weapon

Strong US macro data and wide rate spreads boost the dollar, pressuring EURUSD and gold;…

1 day ago

Top 10 Forex Trading Strategies

We have outlined the 10 best forex trading strategies with clear logic, real-world context, and…

1 day ago

Bitcoin has not crossed the correction line

Bitcoin holds near $95.5K as the market steadies but hasn't confirmed a exit from correction…

1 day ago

CHFJPY Wave Analysis – 15 January 2026

CHFJPY: ⬇️ Sell - CHFJPY reversed from resistance zone - Likely to fall to support level…

2 days ago

WTI Crude Oil Wave Analysis – 15 January 2026

WTI Crude Oil: ⬇️ Sell - WTI Crude Oil rising inside minor impulse wave (1) -…

2 days ago

This website uses cookies