Categories: Technical analysis

Johnson & Johnson Wave Analysis – 24 April, 2020

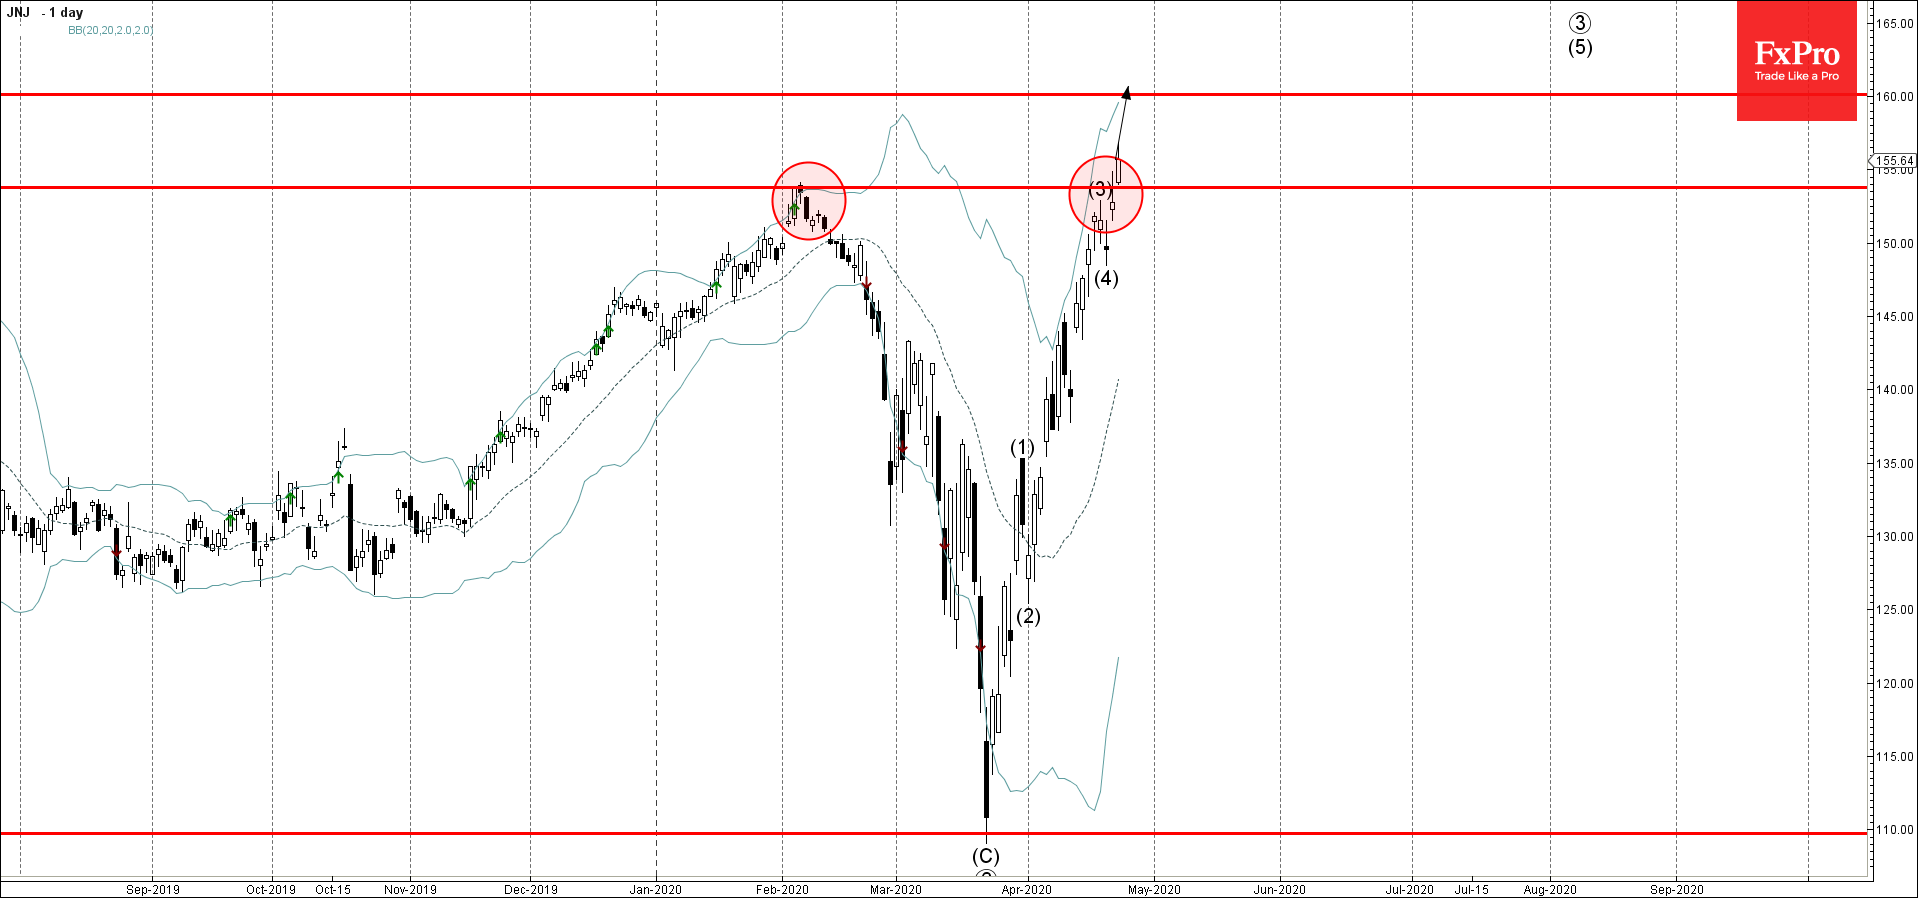
  • Johnson & Johnson broke pivotal resistance level 153.80
  • Likely to rise to 160.00

Johnson & Johnson recently broke above the pivotal resistance level 153.80 (former multi-month high from the start of February)

The breakout of the resistance level 10.00 strengthened the bullish pressure on Johnson & Johnson – accelerating the active medium-term impulse sequence (5).

Johnson & Johnson is expected to rise further toward the next resistance level 160.00. Strong support now stands at the aforementioned price level 153.80.


The FxPro Tech Analysis Team

The FxPro technical experts prepare a daily analysis of the most active currency pairs (majors, crosses, exotics) and commodities. Selected instruments are reviewed on daily trends (D1, H4), using the active Elliott Wave setups, Japanese candlesticks, indicators, and support/resistance levels.

Share
Published by
The FxPro Tech Analysis Team
Tags: JNJ

Recent Posts

Nikkei 225 index Wave Analysis 20 September 2024

- Nikkei 225 index rising inside minor impulse waves 3 - Likely to reach resistance…

15 hours ago

NZDJPY Wave Analysis 20 September 2024

- NZDJPY rising inside corrective wave ii - Likely to rise to resistance level 91.65…

15 hours ago

Gold terminates the last sceptics

Gold started the week with new highs and ended the week up 1.3%, despite a…

21 hours ago

The Crypto Market’s Steady Ascent

Crypto market cap rose by 3.2% to $2.21 trillion overnight. This made the struggle to…

1 day ago

Gold Wave Analysis 19 September 2024

- Gold reversed from support level 2550.00 - Likely to rise to resistance level 2600.00…

2 days ago

S&P 500 Wave Analysis 19 September 2024

- S&P 500 broke key resistance level 5670.00 - Likely to rise to resistance level…

2 days ago

This website uses cookies