
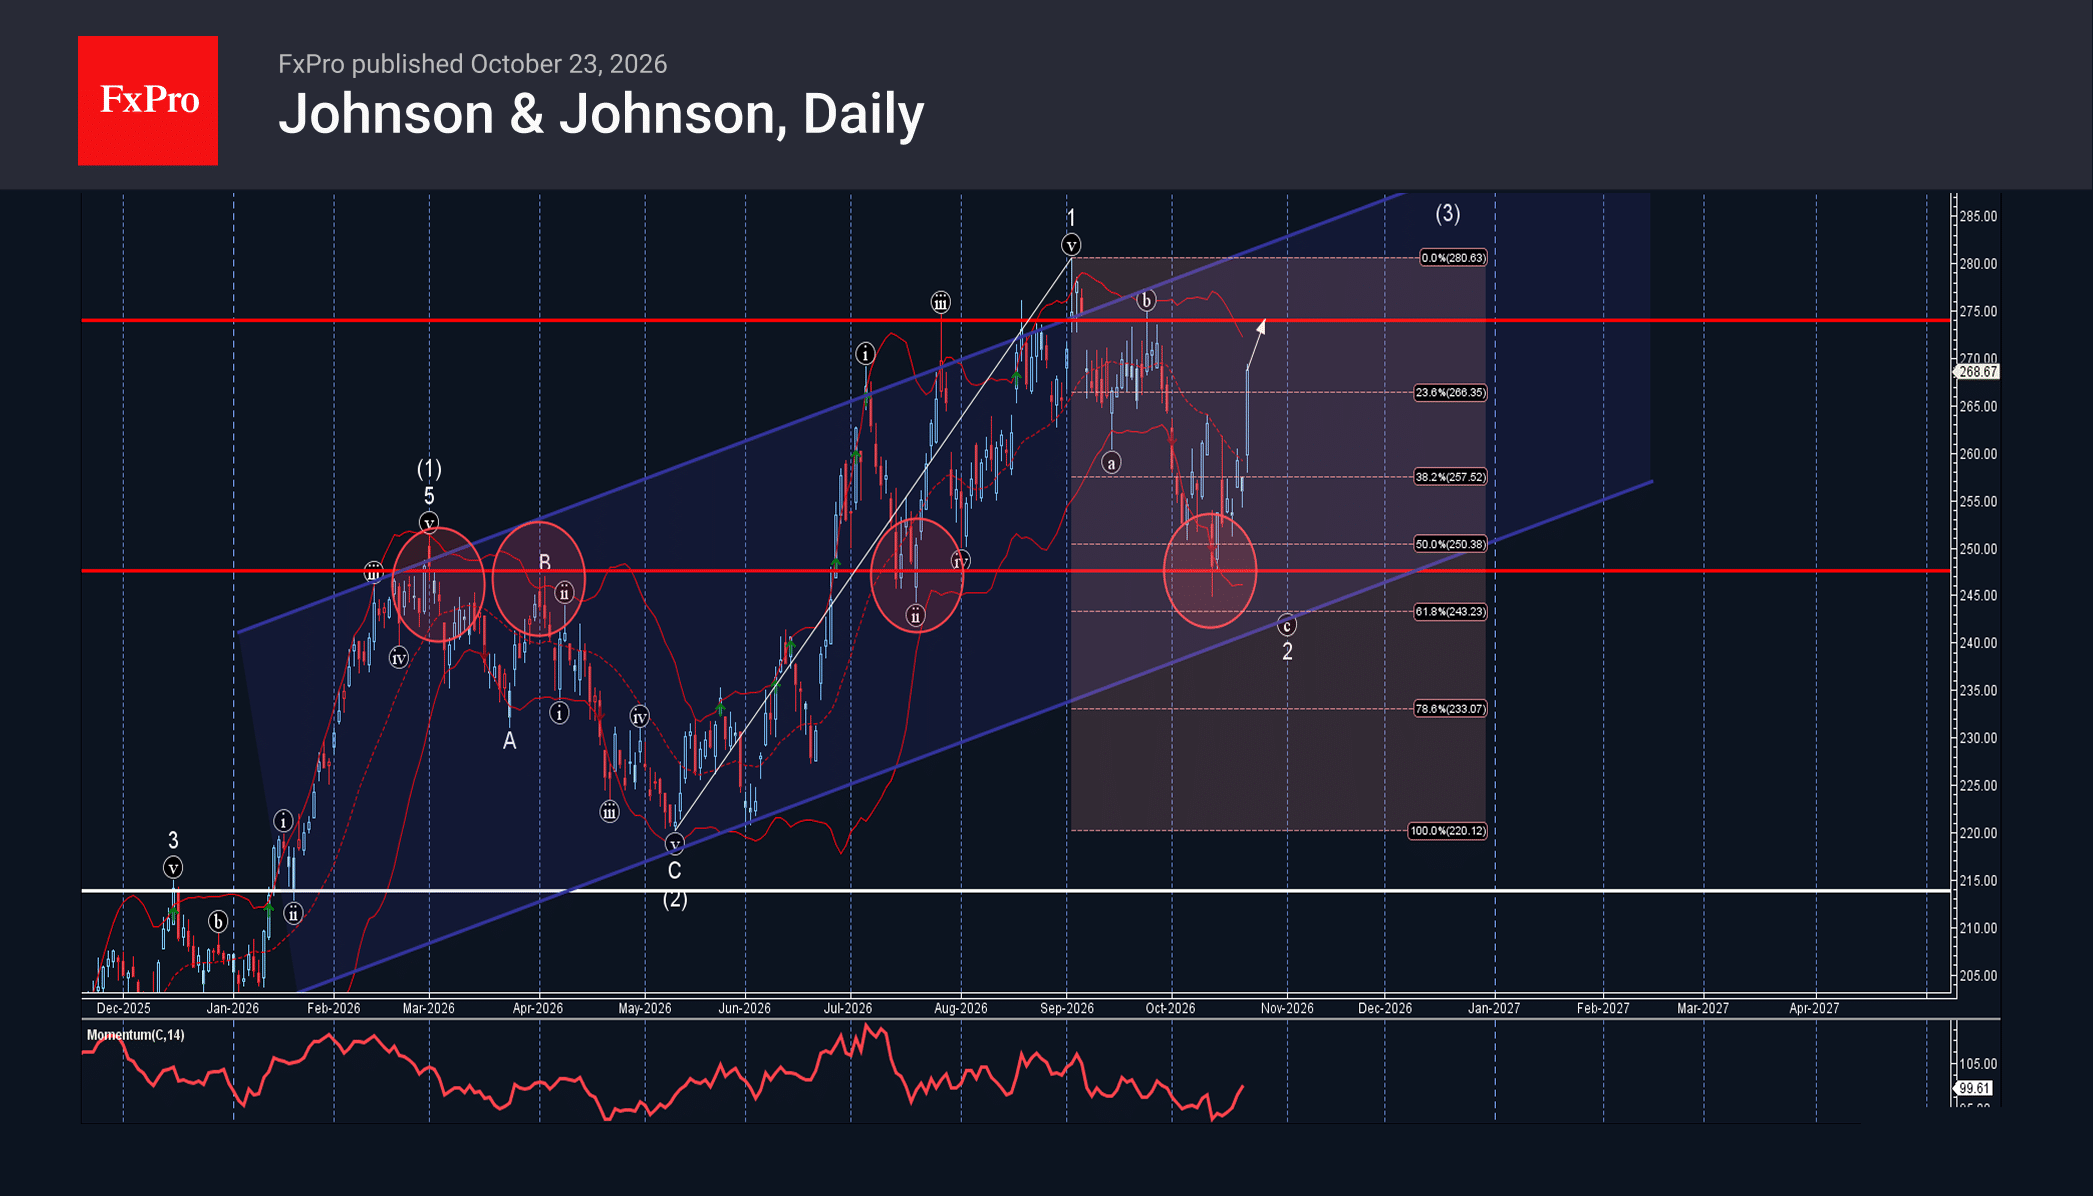
Johnson & Johnson: ⬆️ Buy
– Johnson & Johnson reversed from key support level 248.00
– Likely to rise to resistance level 274.00
Johnson & Johnson recently reversed up from the support zone between the pivotal support level 248.00 (which has been reversing the price from March), lower daily Bollinger Band and the 50% Fibonacci correction of the upward impulse 1 from May.
The upward reversal from this support zone created the daily Bullish Engulfing, which completed the ABC correction 2 from the start of September.
Given the strength of the support level 248.00 and the clear daily uptrend, Johnson & Johnson can be expected to rise further toward the next resistance level 275.00 – which has been reversing the price from July.