Categories: Technical analysis

Johnson & Johnson Wave Analysis 19 November, 2020

• Johnson & Johnson falling inside correction 2

• Likely to reach 142.500

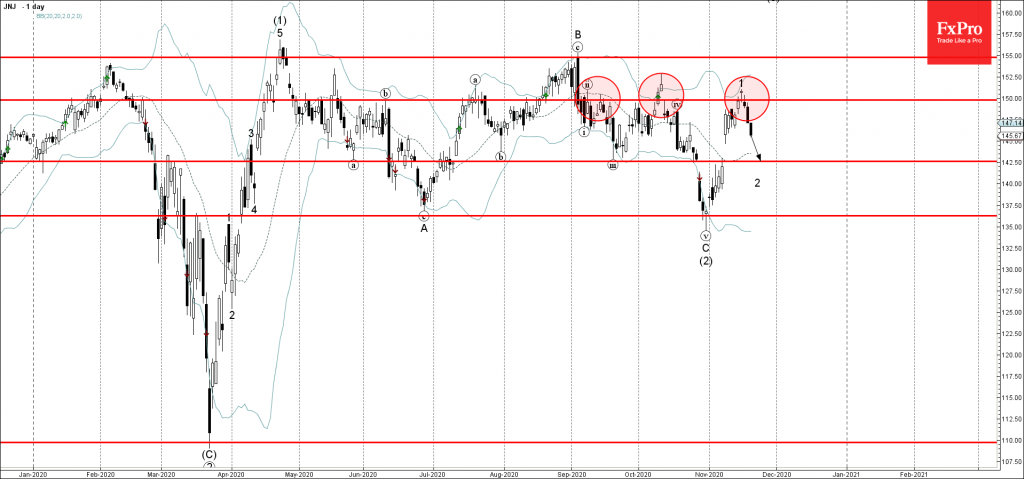
Johnson & Johnson continues to fall inside the sharp downward correction 2, which started earlier from the strong resistance level 150.00 (which has been reversing the price from the start of September).

The downward reversal from the resistance level 150.00 created the daily Japanese candlesticks reversal pattern Evening Star Doji.

Johnson & Johnson is likely to fall further toward the next support level 142.500 (lower boundary of the earlier upward gap formed at the start of November).

AddThis Website Tools
The FxPro Tech Analysis Team

The FxPro technical experts prepare a daily analysis of the most active currency pairs (majors, crosses, exotics) and commodities. Selected instruments are reviewed on daily trends (D1, H4), using the active Elliott Wave setups, Japanese candlesticks, indicators, and support/resistance levels.

Share
Published by
The FxPro Tech Analysis Team
Tags: JNJ

Recent Posts

Adobe Wave Analysis – 13 March 2025

Adobe: ⬇️ Sell - Adobe broke round support level 400.00 - Likely to fall to…

41 minutes ago

Apple Wave Analysis – 13 March 2025

Apple: ⬇️ Sell - Apple broke support area - Likely to fall to support level…

41 minutes ago

Gold Wave Analysis – 13 March 2025

Gold: ⬆️ Buy - Gold broke resistance level 2962.00 - Likely to rise to resistance…

2 hours ago

EURGBP Wave Analysis – 13 March 2025

EURGBP: ⬇️ Sell - EURGBP reversed from key resistance level 0.8450 - Likely to fall…

2 hours ago

Gold climbs on lower rate speculations

The gold price has resumed updating its all-time highs on the back of speculations around…

8 hours ago

Crypto: just a bumpy downtrend

The crypto market experienced a drop, but towards the end of the week, there was…

8 hours ago