Categories: Technical analysis

Johnson & Johnson Wave Analysis – 14 November 2025

Johnson & Johnson: ⬆️ Buy

– Johnson & Johnson broke pivotal resistance level 194.00

– Likely to rise to resistance level 200.00

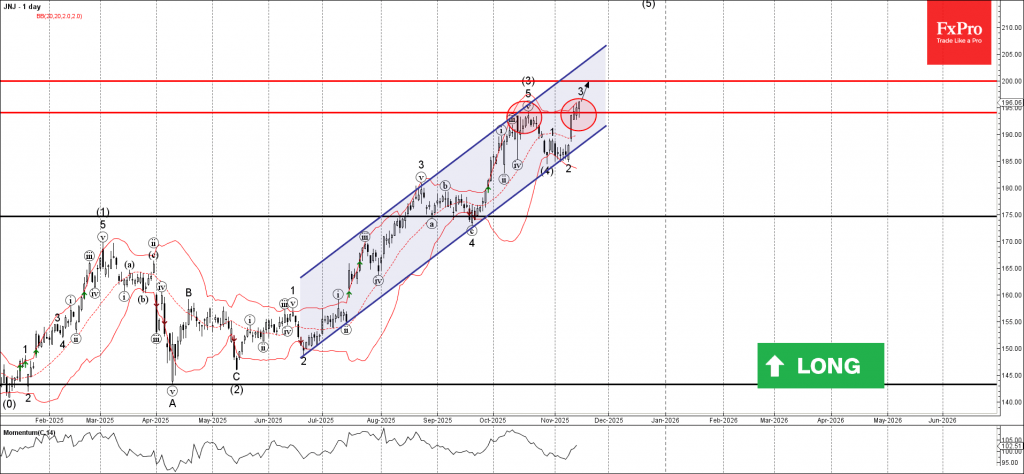
Johnson & Johnson recently broke above the pivotal resistance level 194.00, which stopped the previous impulse wave (3) in the middle of October.

The breakout of the resistance level 194.00 accelerated the active impulse wave 3 – which belongs to the intermediate impulse wave (5) from the end of October.

Given the strong daily uptrend, Johnson & Johnson can be expected to rise to the next round resistance level 200.00 (target for the completion of wave 3).

The FxPro Tech Analysis Team

The FxPro technical experts prepare a daily analysis of the most active currency pairs (majors, crosses, exotics) and commodities. Selected instruments are reviewed on daily trends (D1, H4), using the active Elliott Wave setups, Japanese candlesticks, indicators, and support/resistance levels.

Share
Published by
The FxPro Tech Analysis Team
Tags: JNJ

Recent Posts

CADJPY Wave Analysis – 26 December 2025

CADJPY: ⬆️ Buy - CADJPY broke resistance level 114.30 - Likely to rise to resistance…

1 day ago

Toncoin Wave Analysis – 26 December 2025

Toncoin: ⬆️ Buy - Toncoin reversed from support zone - Likely to rise to resistance…

1 day ago

Nvidia Wave Analysis – 26 December 2025

Nvidia: ⬆️ Buy - Nvidia reversed from support zone - Likely to rise to resistance…

1 day ago

Palladium Wave Analysis – 26 December 2025

Palladium: ⬆️ Buy - Palladium reversed from support zone - Likely to rise to resistance…

1 day ago

AUDUSD Wave Analysis – 24 December 2025

AUDUSD: ⬆️ Buy - AUDUSD broke key resistance level 0.6690 - Likely to rise to…

3 days ago

Tron Wave Analysis – 24 December 2025

Tron: ⬇️ Sell - Tron reversed from resistance zone - Likely to fall to support…

3 days ago

This website uses cookies