Categories: Technical analysis

Intel Wave Analysis – 05 December, 2019

  • Intel falling inside impulse wave (3)
  • Likely to fall to 55.45

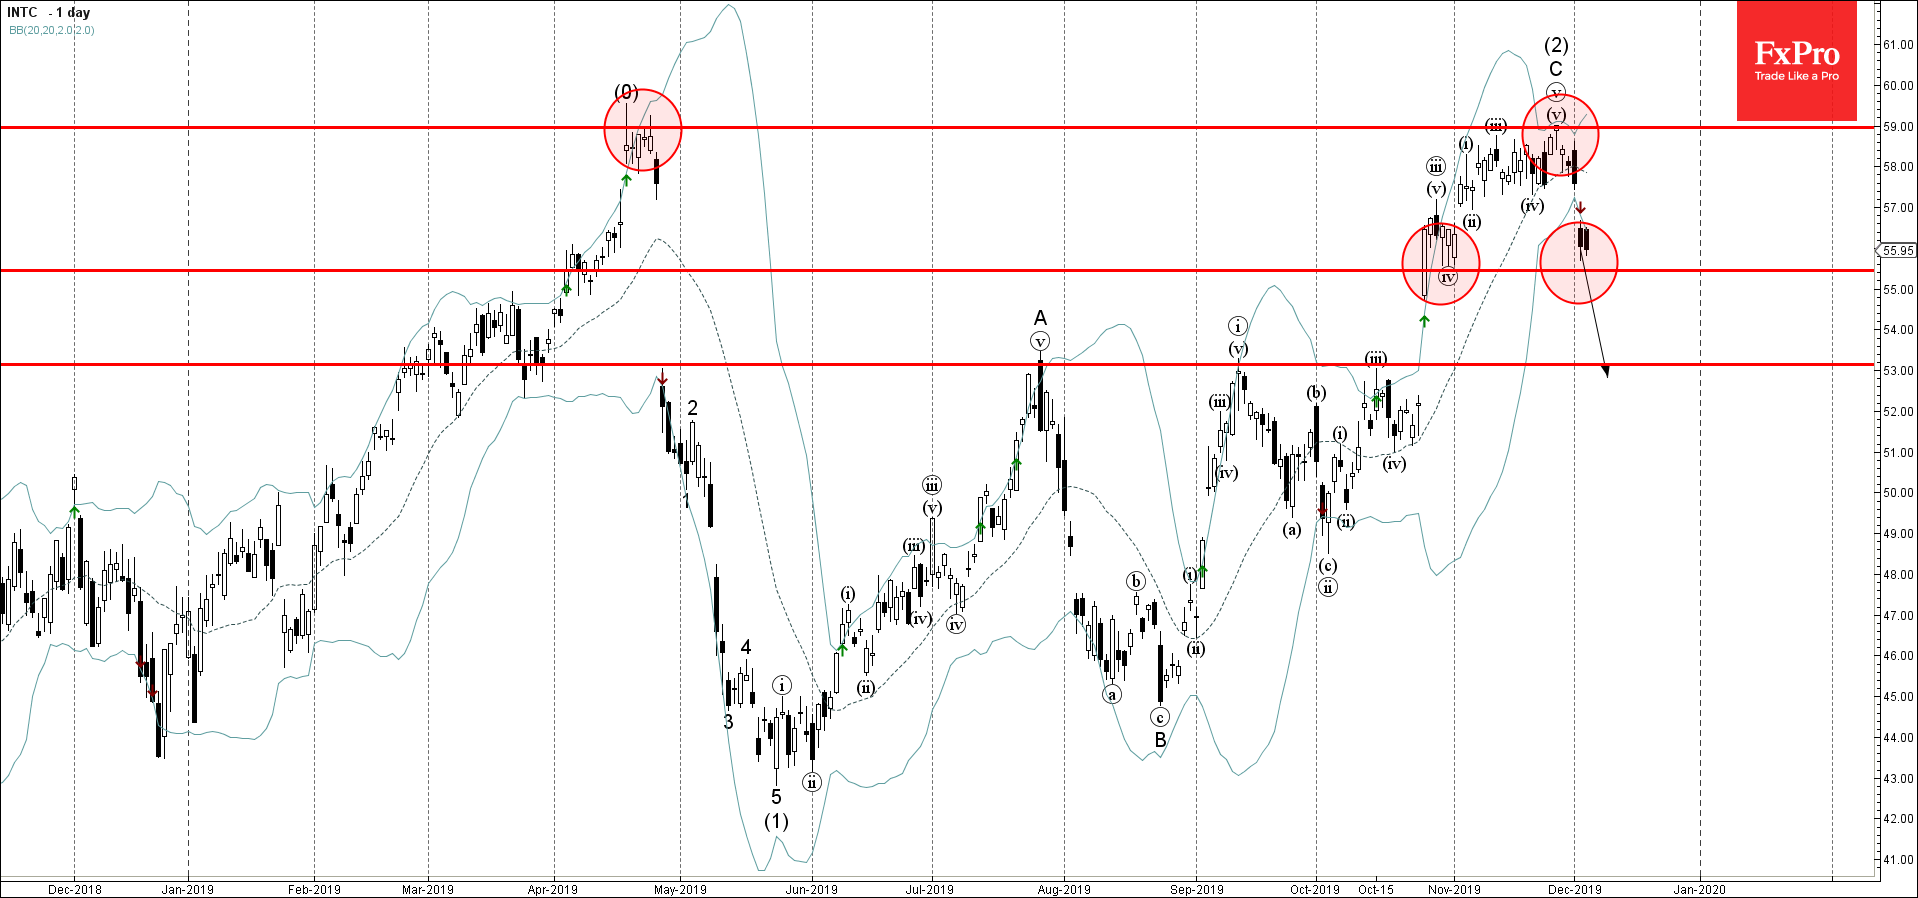
Intel under bearish pressure after the earlier downward reversal from the resistance area lying between he resistance level 59,00 (former multi-month high from April) and the upper daily Bollinger Band.

The downward reversal from this resistance area started the active medium-term impulse wave (3).

Intel is expected to fall further toward the next support level 55.45 (low of the previous wave (iv)) – the breakout of which can lead to further losses toward the next support level 53,00.


The FxPro Tech Analysis Team

The FxPro technical experts prepare a daily analysis of the most active currency pairs (majors, crosses, exotics) and commodities. Selected instruments are reviewed on daily trends (D1, H4), using the active Elliott Wave setups, Japanese candlesticks, indicators, and support/resistance levels.

Share
Published by
The FxPro Tech Analysis Team
Tags: INTC

Recent Posts

ADP hints at another strong NFP on Friday  

The monthly ADP labour market report showed that America created 192K new jobs in April, above…

14 mins ago

Fed’s hawkish tone risks sinking S&P500 to 4700

Bears showed strength ahead of the FOMC decision.  U.S. indices sagged on Tuesday as investors…

4 hours ago

A new stage of Bitcoin’s decline

Market Picture  Bitcoin's closing price on Tuesday became the lowest since late February, confirming the…

7 hours ago

Ebay Wave Analysis 30 April 2024

- Ebay under the bearish pressure - Likely to fall to support level 51.00 Ebay…

21 hours ago

GBPAUD Wave Analysis 30 April 2024

- GBPAUD reversed from key support level 1.9135 - Likely to rise to resistance level…

21 hours ago

Silver: a possible long road down

Silver has lost 2.6% since the start of the day on Tuesday to $26.4 per…

24 hours ago

This website uses cookies