Categories: Technical analysis

IBM Wave Analysis – 9 September 2025

IBM: ⬆️ Buy

– IBM broke resistance area

– Likely to rise to resistance level 265.00

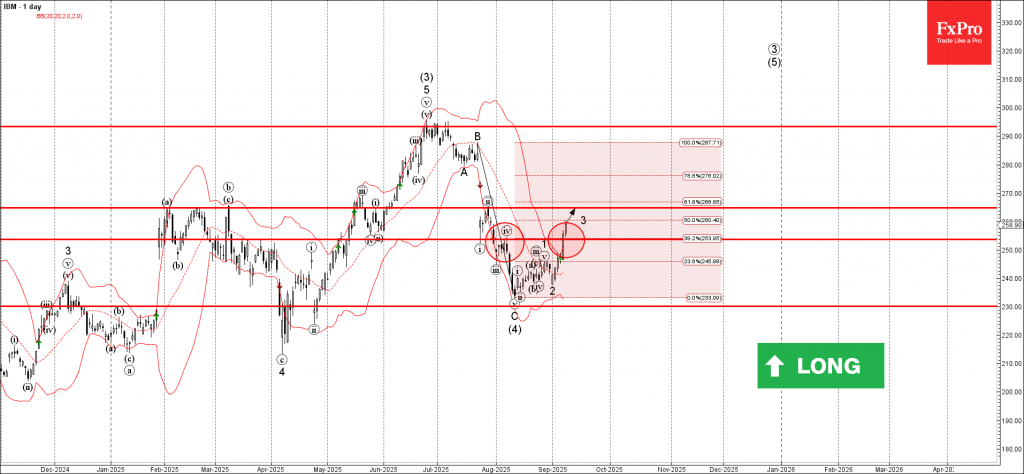
IBM recently broke resistance area between the resistance level 253.60 (which has been reversing the price from the start of August) and the 38.2% Fibonacci correction of the downward impulse C from July.

The breakout of this resistance area accelerated active short-term impulse wave 3 of wave (5) from the start of August.

IBM can be expected to rise toward the next resistance level 265.00 (former top of wave iv from July and the target price for the completion of the active impulse wave 3).

The FxPro Tech Analysis Team

The FxPro technical experts prepare a daily analysis of the most active currency pairs (majors, crosses, exotics) and commodities. Selected instruments are reviewed on daily trends (D1, H4), using the active Elliott Wave setups, Japanese candlesticks, indicators, and support/resistance levels.

Share
Published by
The FxPro Tech Analysis Team
Tags: IBM

Recent Posts

EURAUD Wave Analysis – 6 January 2026 Wave Analysis – 6 January 2026

EURAUD: ⬇️ Sell - EURAUD broke strong support level 1.7465 - Likely to fall to…

2 hours ago

IBM Wave Analysis – 6 January 2026

IBM: ⬆️ Buy - IBM reversed from support zone - Likely to rise to resistance…

2 hours ago

Palladium Wave Analysis – 6 January 2026

Palladium: ⬆️ Buy - Palladium reversed from round support level 1600.00 - Likely to rise…

2 hours ago

Amazon Wave Analysis – 6 January 2026

Amazon: ⬆️ Buy - Amazon broke resistance zone - Likely to rise to resistance level…

2 hours ago

Pro News Flash: Gold Bulls Take Control

🥇 Gold is regaining momentum as investors lean into geopolitics, a softer US dollar and…

8 hours ago

The dollar is forced to retreat

• The reduction in geopolitical risks in Venezuela has weakened the greenback. •  Precious metal investors…

12 hours ago

This website uses cookies