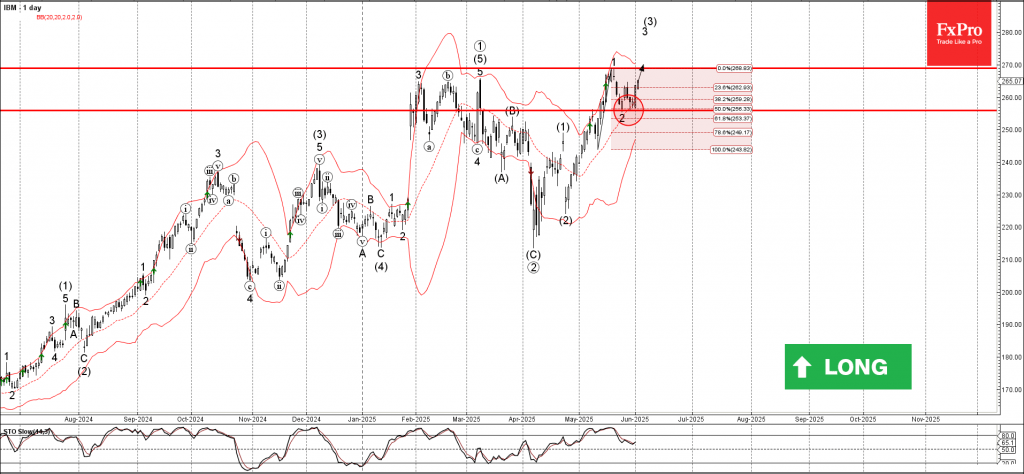
Categories: Technical analysis

IBM Wave Analysis – 3 June 2025

IBM: ⬆️ Buy

– IBM reversed from the support zone

– Likely to rise to the resistance level 270.00

IBM recently reversed up from the support zone between the support level 255.90 (low of the previous correction 2), the 20-day moving average and the 61.8% Fibonacci correction of the upward impulse from May.

The upward reversal from this support zone continues the active impulse waves 3 and (3).

Given the clear daily uptrend, IBM can be expected to rise to the next resistance level 270.00 (which stopped the earlier impulse wave 1 in the middle of May).

The FxPro Tech Analysis Team

The FxPro technical experts prepare a daily analysis of the most active currency pairs (majors, crosses, exotics) and commodities. Selected instruments are reviewed on daily trends (D1, H4), using the active Elliott Wave setups, Japanese candlesticks, indicators, and support/resistance levels.

Share
Published by
The FxPro Tech Analysis Team
Tags: IBM

Recent Posts

Geopolitics will destroy the euro

•    EURUSD falls due to geopolitics and expectations of tariff removal •    Gold returns to…

5 hours ago

Platinum Wave Analysis – 8 January 2026

Platinum: ⬇️ Sell - Platinum reversed from pivotal resistance level 150.00 - Likely to fall to…

18 hours ago

Baidu Wave Analysis – 8 January 2026

Baidu: ⬇️ Sell - Baidu reversed from resistance zone - Likely to fall to support level…

18 hours ago

EURUSD Wave Analysis – 8 January 2026

EURUSD: ⬇️ Sell - EURUSD broke daily up channel - Likely to fall to support…

20 hours ago

WTI crude oil Wave Analysis – 8 January 2026

WTI crude oil: ⬆️ Buy - WTI crude oil reversed from support zone - Likely…

20 hours ago

Do not underestimate dollar

Positive macro statistics for the US are helping the greenback. Gold could rise to $4,610…

1 day ago

This website uses cookies