Categories: Technical analysis

IBM Wave Analysis – 14 May, 2020

• IBM broke support zone

• Likely to fall to 12.40

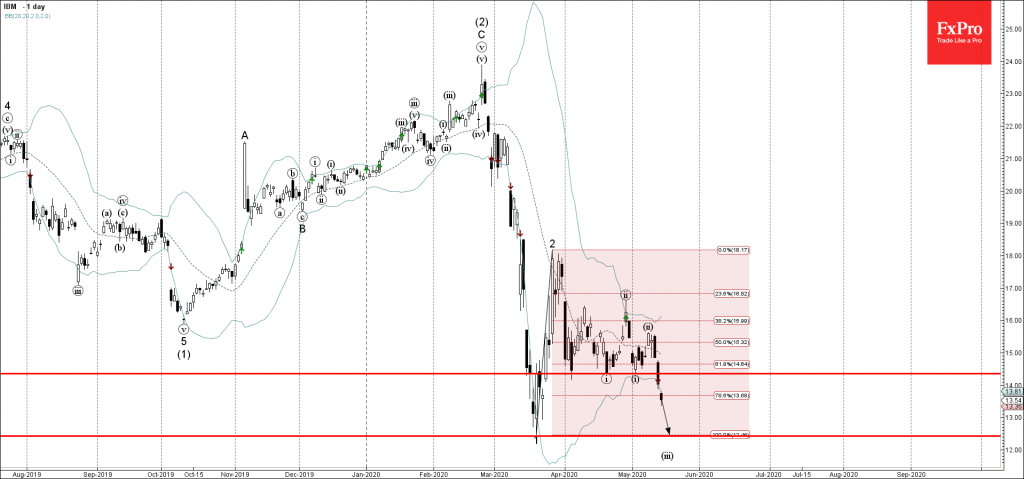
IBM today broke the support zone lying between the pivotal support level 14.35 (which has been reversing the price from March) and the 61.8% Fibonacci correction of the upward correction 2.

The breakout of this support zone is aligned with the active minor impulse wave (iii) of the long-term impulse waves 3 and (3).

IBM is likely to fall further toward the next strong support level 12.40 (low of the previous sharp impulse wave 1 from March).

The FxPro Tech Analysis Team

The FxPro technical experts prepare a daily analysis of the most active currency pairs (majors, crosses, exotics) and commodities. Selected instruments are reviewed on daily trends (D1, H4), using the active Elliott Wave setups, Japanese candlesticks, indicators, and support/resistance levels.

Share
Published by
The FxPro Tech Analysis Team
Tags: IBM

Recent Posts

Adobe Wave Analysis 3 May 2024

- Adobe reversed from support zone - Likely to rise to resistance level 500.00 Adobe…

2 days ago

EURGBP Wave Analysis 3 May 2024

- EURJPY reversed from support zone - Likely to rise to resistance level 0.8625 EURGBP…

2 days ago

How Low Can the USDJPY Go?

USDJPY was slipping below 153 on Friday morning, a three-week low and having lost over…

2 days ago

Bitcoin’s Downtrend, Solana and Ethereum Form Double Bottom

Market picture  Crypto market capitalisation rose 3.3% in 24 hours to $2.22 trillion. Local capitalisation…

3 days ago

EURJPY Wave Analysis 2 May 2024

- EURJPY under strong bearish pressure - Likely to fall to support level 163.10 EURJPY…

3 days ago

WTI crude oil Wave Analysis 2 May 2024

- WTI broke round support level 80.00 - Likely to fall to support level 76.00…

3 days ago

This website uses cookies