Categories: Technical analysis

IBEX 35 Wave Analysis 3 March, 2021

• IBEX 35 reversed from powerful resistance area

• Likely to test support level 8000.00

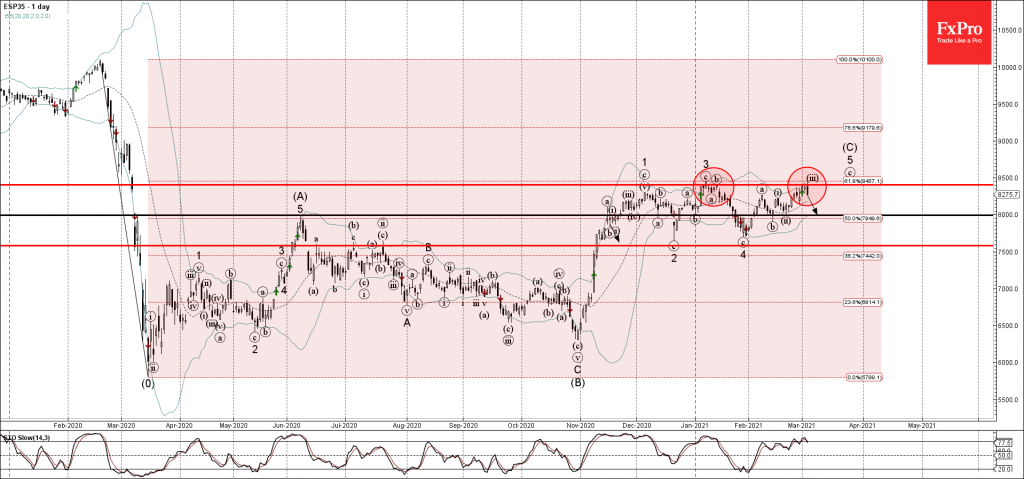
IBEX 35 index recently reversed down from the powerful resistance area lying between the key resistance level 8406.5 (former monthly high from January) and the upper daily Bollinger Band.

This resistance area was further strengthened by the 61.8% Fibonacci correction level of the previous sharp downward impulse from February to March of 2020.

IBEX 35 index is likely to fall further toward the next round support level 8000.00 (top of the previous 2 corrections (b) and (ii)).

The FxPro Tech Analysis Team

The FxPro technical experts prepare a daily analysis of the most active currency pairs (majors, crosses, exotics) and commodities. Selected instruments are reviewed on daily trends (D1, H4), using the active Elliott Wave setups, Japanese candlesticks, indicators, and support/resistance levels.

Share
Published by
The FxPro Tech Analysis Team
Tags: Spain

Recent Posts

Brent Crude oil Wave Analysis – 13 January 2026

Brent Crude oil ⬆️ Buy - Brent Crude oil rising inside impulse wave c -…

9 hours ago

USDJPY Wave Analysis – 13 January 2026

USDJPY ⬆️ Buy - USDJPY broke resistance area - Likely to rise to resistance level…

9 hours ago

Exxon Mobil Wave Analysis – 13 January 2026

Exxon Mobil ⬆️ Buy - Exxon Mobil broke resistance level 125.60 - Likely to rise…

9 hours ago

BNB Wave Analysis – 13 January 2026

Brent Crude oil ⬆️ Buy - BNB broke out of sideways price range - Likely…

9 hours ago

A slightly weaker CPI was not enough to break through the highs

US CPI data a bit softer than forecasts, sparking brief market optimism, but resistance remains.…

15 hours ago

Pro News Flash: Global Tensions Fuel a Fresh Oil Rally

🛢️ Oil prices are finding fresh strength as geopolitical tensions in the Middle East reignite…

15 hours ago

This website uses cookies