Categories: Technical analysis

HSI50 Wave Analysis 6 April, 2021

• HSI50 broke daily down channel

• Likely to reach resistance level 29500.00

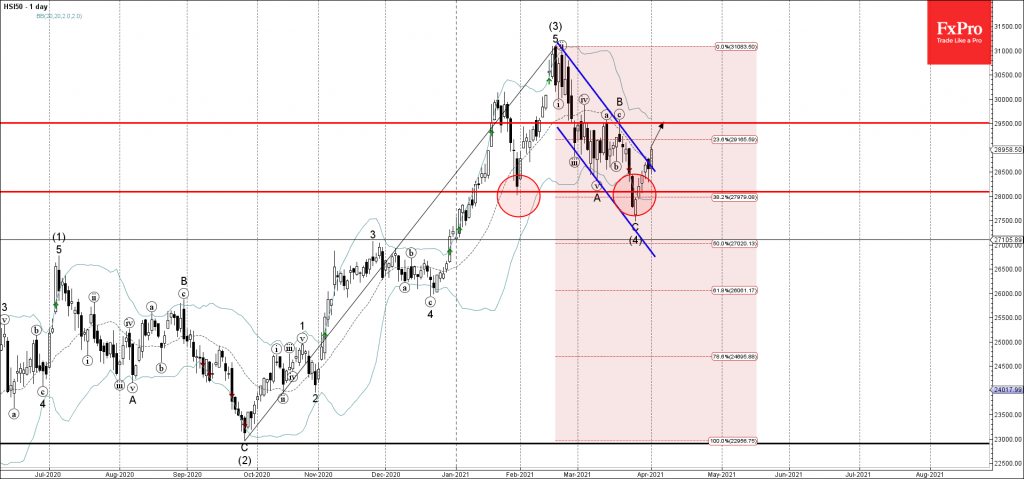
HSI50 index recently broke the resistance trendline of the daily down channel from the middle of February  – accelerating the active intermediate impulse wave (5).

Wave (5) started earlier from the strong combined support zone surrounding the support level 28000.00 (low of the Bullish Engulfing from the end of January).

HSI50 is likely to rise further toward the next resistance level 29500.00 (top of the previous correction B from the middle of March).

The FxPro News Team

This team of professional journalists announces the most interesting and influential articles from the major financial media as a brief summary. All such news may have sufficient potential to affect the course of trading assets.

Share
Published by
The FxPro News Team

Recent Posts

USDJPY Wave Analysis 6 May 2024

- USDJPY reversed from support zone - Likely to rise to resistance level 155.65 USDJPY…

11 hours ago

Gold Wave Analysis 6 May 2024

- Gold reversed from support zone - Likely to rise to resistance level 2400.00 Gold…

11 hours ago

Oil Bounces Locally, Global Support 5% below Spot Price

The number of operating oil rigs in the US fell by 7 to 499. This…

15 hours ago

Crypto Market Tries to Break Local Downtrend

Market picture  Crypto market capitalisation has been up 2% over the past seven days and…

22 hours ago

Adobe Wave Analysis 3 May 2024

- Adobe reversed from support zone - Likely to rise to resistance level 500.00 Adobe…

3 days ago

EURGBP Wave Analysis 3 May 2024

- EURGBP reversed from support zone - Likely to rise to resistance level 0.8625 EURGBP…

3 days ago

This website uses cookies