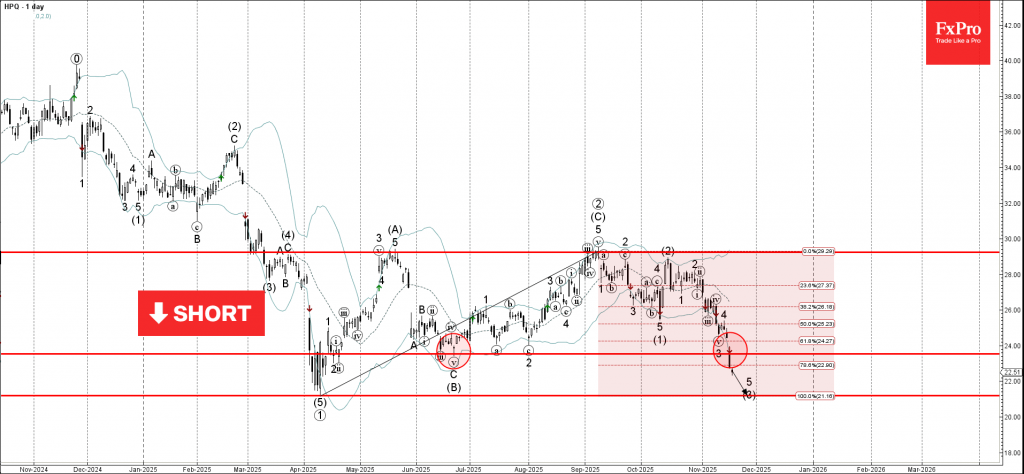
Categories: Technical analysis

HPQ Wave Analysis – 18 November 2025

HPQ: ⬇️ Sell

– HPQ broke support level 23.50

– Likely to fall to support level 21.20

HPQ recently broke the support level 23.50 (former monthly low from June, which stopped wave (B) of the previous long-term ABC correction 2 from April).

The breakout of the support level 23.50 accelerated the active impulse wave 5 of the intermediate impulse wave (3) from October.

Given the strong daily downtrend, HPQ can be expected to fall further to the next support level 21.20 (former multi-month low from April and the target price for the completion of the active impulse waves 5 and (3)).

The FxPro Tech Analysis Team

The FxPro technical experts prepare a daily analysis of the most active currency pairs (majors, crosses, exotics) and commodities. Selected instruments are reviewed on daily trends (D1, H4), using the active Elliott Wave setups, Japanese candlesticks, indicators, and support/resistance levels.

Share
Published by
The FxPro Tech Analysis Team
Tags: HPQ

Recent Posts

NZDCAD Wave Analysis – 7 January 2026

NZDCAD: ⬆️ Buy - NZDCAD reversed from support zone - Likely to rise to resistance…

5 hours ago

Bitcoin Wave Analysis – 7 January 2026

Bitcoin: ⬇️ Sell - Bitcoin reversed from resistance zone - Likely to fall to support…

5 hours ago

EURGBP Wave Analysis – 7 January 2026

EURGBP: ⬆️ Buy - EURGBP reversed from support zone - Likely to rise to resistance…

5 hours ago

Brent Crude Oil Wave Analysis – 7 January 2026

Brent Crude Oil: ⬇️ Sell - Brent Crude Oil reversed from resistance zone - Likely…

5 hours ago

Old fears about the euro have returned

The resurgence of the political crisis in France is weighing on EURUSD The US dollar…

14 hours ago

The crypto market has hit the upper limit of its rebound

The crypto market faces resistance at $3.2T; sentiment rises, but selling pressure persists. Bitcoin and…

17 hours ago

This website uses cookies